
Wall Street tumbled further overnight as the Fat Fuhrer again showed his exemplary trade making deals with a blustery response to the EU counter tariff schemes, all the while insulting the Irish PM to his face and giving short sellers a great opportunity to dump tech stocks. The USD is still somewhat mixed following the weaker than expected CPI print and is just holding on against the major undollars although Euro is pulling back slightly while the Australian dollar was again thwarted in getting back above the 63 cent level.
10 year Treasury yields pulled back slightly to retreat down to the low 4.2% level while oil prices couldn’t follow through with their recent bounceback with Brent crude staying at the $70USD per barrel level. Gold was the highlight overnight though, zooming nearly $60USD higher to almost breach the $3000USD per ounce level.
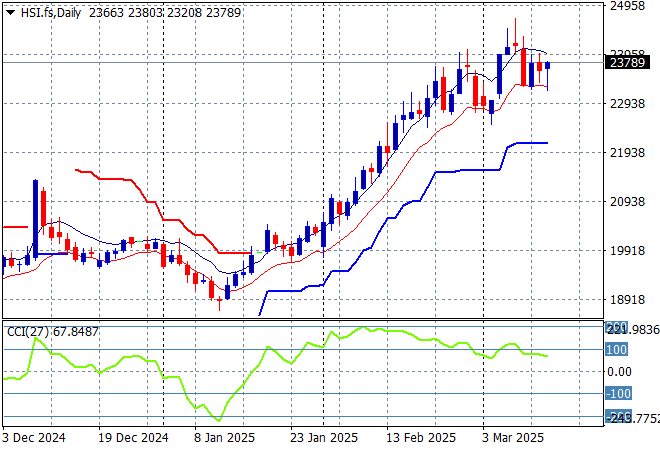
Looking at stock markets from Asia from yesterday’s session, where mainland Chinese share markets moved sharply lower in afternoon trade before slightly recovering with the Shanghai Composite down nearly 0.5% while the Hang Seng Index lost nearly 0.6% to finish at the 23462 point level.
The Hang Seng Index daily chart shows how this recent move looked unsustainable to the upside after recently setting up for another potential breakdown around the 20000 point level but has brushed this caution aside. Momentum remains overbought after beating the previous monthly highs at the 21500 level but as I warned last week – be cautious here in the face of another reversal:
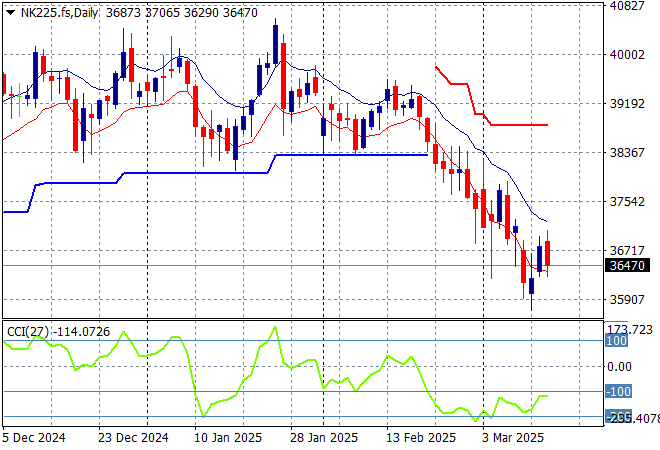
Japanese stock markets however were initially on the rise again with the Nikkei 225 up nearly 0.3% before stumbling at the close to finish 0.1% lower at 36790 points.
Price action had been indicating a rounding top on the daily chart for sometime now with daily momentum retracing away from overbought readings with the breakout last month above the 40000 point level now in full remission. Yen volatility remains a problem here, with a sustained return above the 38000 point level unlikely although futures are indicating a bounce back:
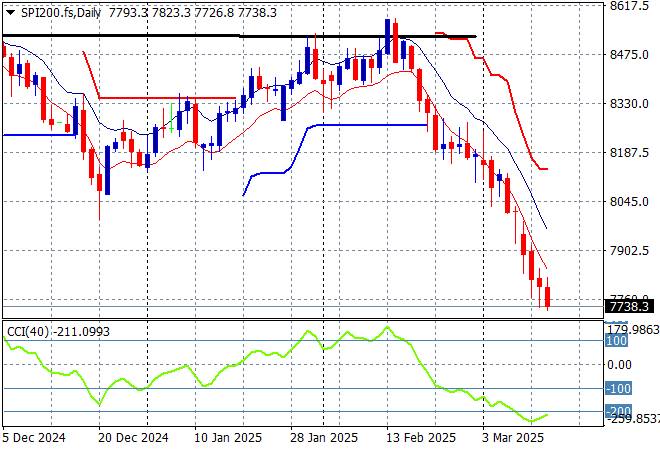
Australian stocks had another selloff with the ASX200 closing nearly 0.5% lower at 7749 points.
SPI futures are off slightly again due to the falls on Wall Street from overnight with the 7700 point likely to come under attack in today’s final session for the trading week. The daily chart pattern suggests entrenched resistance overhead at the 8500 point level is far too heavy for the market to overcome with short term momentum oversold and ready to go lower:
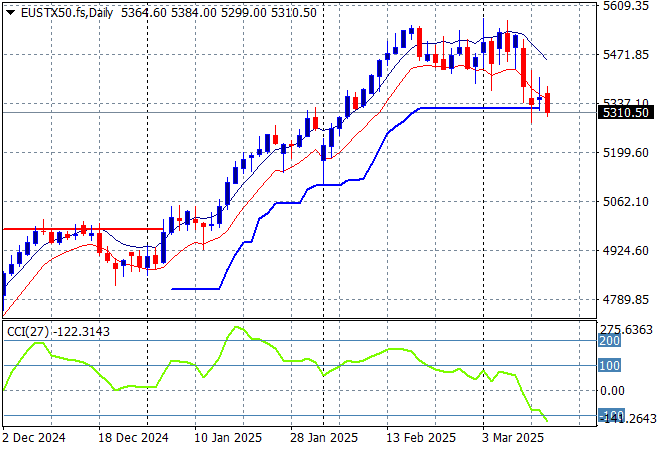
European markets were unable to rebound after a series of falling sessions across the continent, with the Eurostoxx 50 Index finishing nearly 0.6% lower at 5328 points.
This is setting up for a breakdown with short term support taken out and the ATR support from the recent uptrend now under threat as momentum goes into oversold mode:
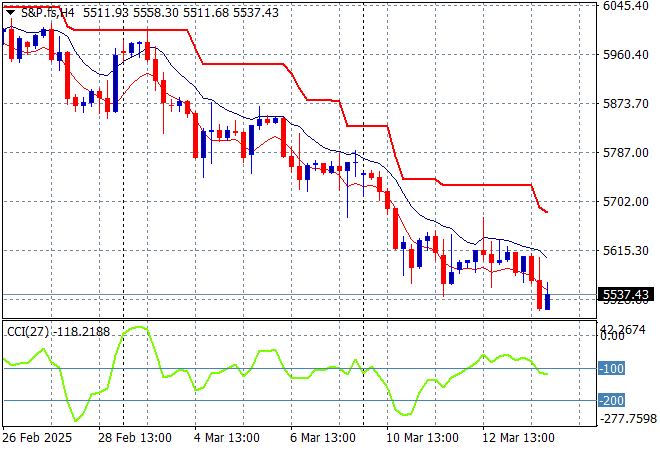
Wall Street can’t catch a break but this has all been engineered to do so with the NASDAQ off another 2% lower while the S&P500 fell nearly 1.5% on the broadening on the Trump Foot Shoot Fest, finishing at 5521 points.
The Trump pump and dump scheme is working a treat here as overhead resistance rejected further calls to launch higher above that 6000 points throughout Jan and Feb with momentum now taking the market back to the September 2024 lows and possibly lower. But watch for the bottom pickers here:
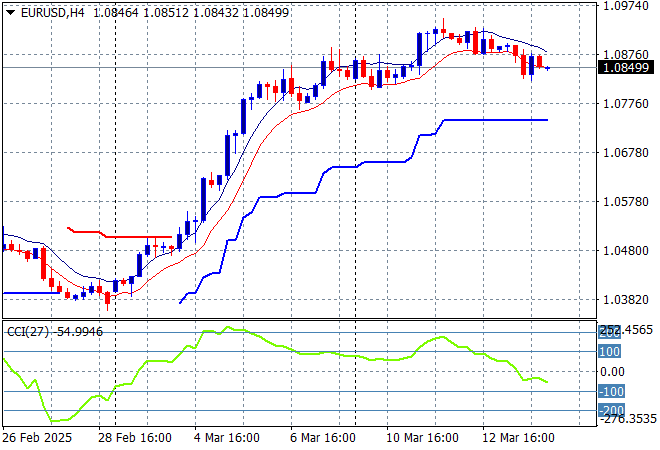
Currency markets remain strongly against King Dollar and the weaker than expected US CPI print is not helping that much although Euro has retraced slightly after almost hitting the 1.09 level itself.
The union currency is still holding on despite the tariff trade war with short and medium term support building at higher levels. Momentum was overextended earlier in the week and has now re-engaged to the upside although a potential pullback move is building here:
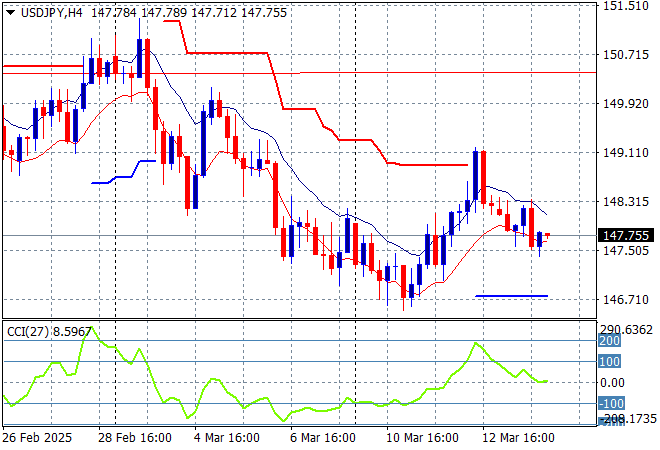
The USDJPY pair was trying to get out of its funk after a very brief deceleration phase into the early February lows around the 151 level as but it was shortlived after the CPI print with a return to the mid 147 level instead.
Short term momentum was extremely oversold before the start of week bounce but required price action to at least get over the 156 level to call this a proper trend higher. As USD weakens structurally overall and domestic policies continue to strengthen Yen watch for another return below the 146 level:
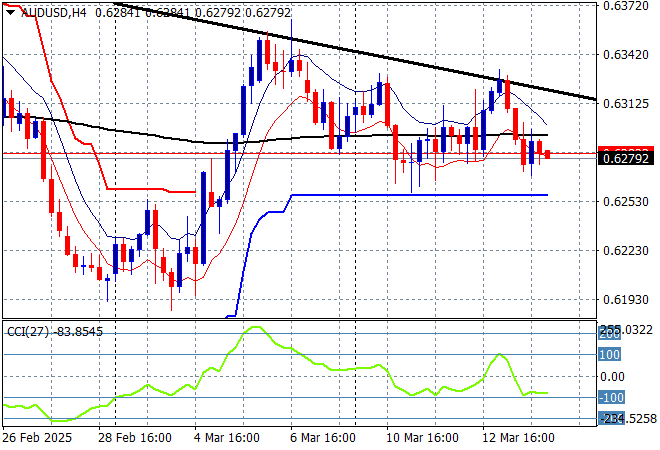
The Australian dollar is failing hard to get back into the swing of things with some recent upper movement around the 63 cent level now thwarted completely although support just below is staying strong.
The recent follow through to the high 62’s and low 63’s was always high risk going into the live February RBA rate meeting and after the Trumpian tariff crusade although this bounceback could shoot over the 200 day MA (moving black line) with a clear inverted head and shoulders pattern on the daily chart:
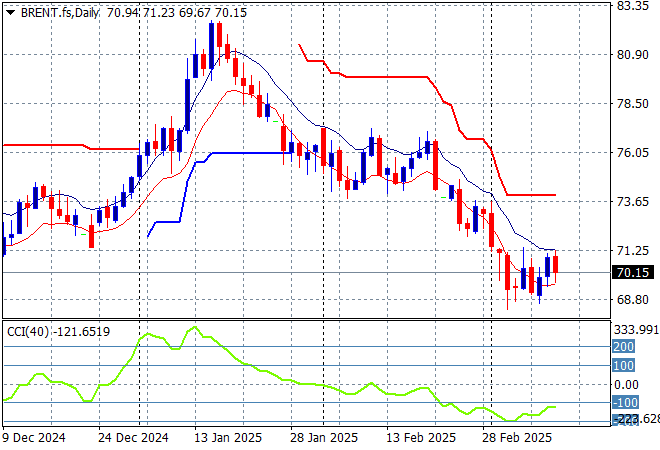
Oil markets are failing to get back on track as Brent crude struggled again overnight after recently showing some life above the $70USD per barrel level with a near full inversion instead.
The daily chart pattern shows the post New Year rally that got a little out of hand and now reverting back to the sideways lower action for the latter half of 2024. The potential for a return to the 2024 lows is building here:
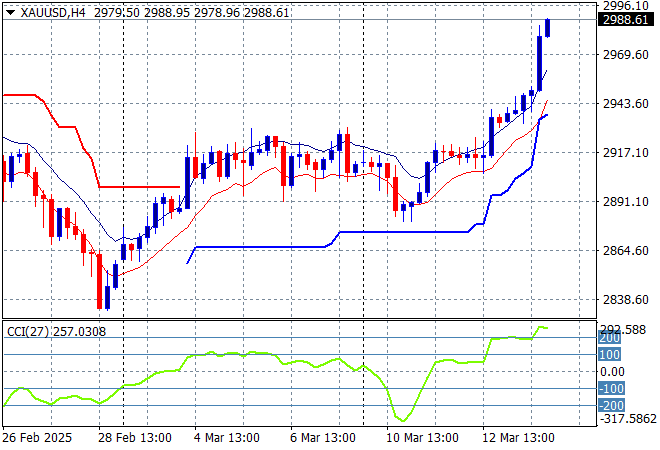
Gold is surging ahead – this is a telling signal surely – as it not only managed to remain above the $2900USD per ounce level overnight but zoomed up towards the $3000 level in a very overbought way!
Price action has always found a lot of resistance just under the $2960 zone so that was the likely target in any upside potential but that has been deftly pushed aside but I await for the obvious short term pullback to then re-engage to the upside:
Glossary of Acronyms and Technical Analysis Terms:
ATR: Average True Range – measures the degree of price volatility averaged over a time period
ATR Support/Resistance: a ratcheting mechanism that follows price below/above a trend, that if breached shows above average volatility
CCI: Commodity Channel Index: a momentum reading that calculates current price away from the statistical mean or “typical” price to indicate overbought (far above the mean) or oversold (far below the mean)
Low/High Moving Average: rolling mean of prices in this case, the low and high for the day/hour which creates a band around the actual price movement
FOMC: Federal Open Market Committee, monthly meeting of Federal Reserve regarding monetary policy (setting interest rates)
DOE: US Department of Energy
Uncle Point: or stop loss point, a level at which you’ve clearly been wrong on your position, so cry uncle and get out/wrong on your position, so cry uncle and get out!