
Wall Street’s rebound from Friday night continued overnight across most risk markets despite a lacklustre US retail sales print as trader’s await this week’s FOMC meeting from the Federal Reserve. European stocks continue to outperform while the USD slipped further against Euro and Pound Sterling while building somewhat against Yen although that maybe in anticipation of the upcoming BOJ meeting. Meanwhile the Australian dollar was able to hold above the 63 cent level.
10 year Treasury yields were flat at the 4.3% level while oil prices couldn’t follow through with their recent bounceback with Brent crude staying at the $70USD per barrel level. Gold was the biggest mover as it finally got above the $3000USD per ounce level!
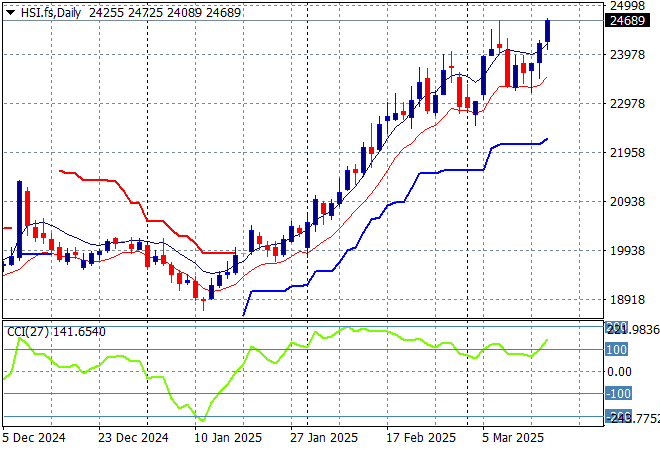
Looking at stock markets from Asia from yesterday’s session, where mainland Chinese share markets are only slightly higher in afternoon trade with the Shanghai Composite up nearly 0.2% while the Hang Seng Index has pulled nearly 1% higher to finish at 24145 points.
The Hang Seng Index daily chart shows how this recent move looked unsustainable to the upside after recently setting up for another potential breakdown around the 20000 point level but has brushed this caution aside. Momentum remains well overbought after beating the previous monthly highs at the 21500 level but as I warned last week – be cautious here in the face of another reversal:
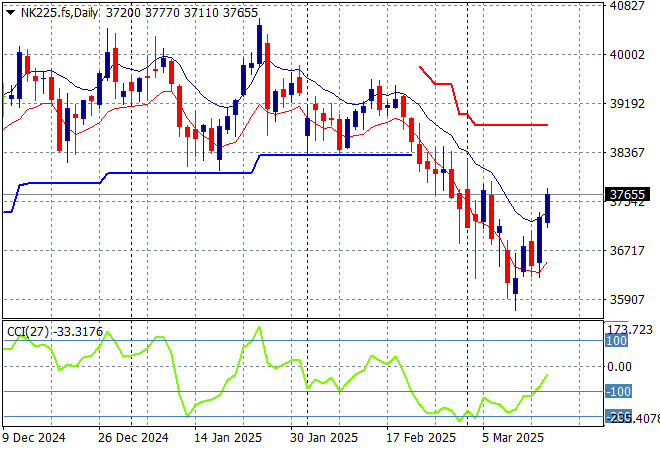
Japanese stock markets were also on the rise again with the Nikkei 225 up nearly 1.2% to close at 37479 points.
Price action had been indicating a rounding top on the daily chart for sometime now with daily momentum retracing away from overbought readings with the breakout last month above the 40000 point level now in full remission. Yen volatility remains a problem here, with a sustained return above the 38000 point level unlikely although futures are indicating a bounce back:
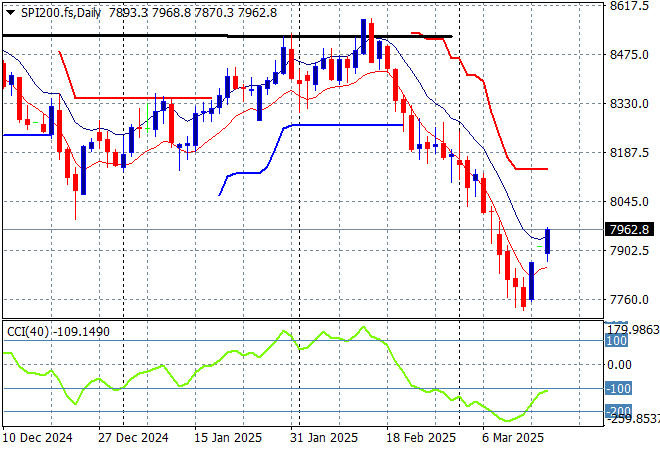
Australian stocks finally stopped selling off with the ASX200 closing nearly 0.9% higher at 7854 points.
SPI futures are up nearly 0.7% due to the continued rebound on Wall Street overnight. The daily chart pattern suggests entrenched resistance overhead at the 8500 point level is far too heavy for the market to overcome with short term momentum very oversold and ready to reverse into a short term bounce towards the 7800 point level:
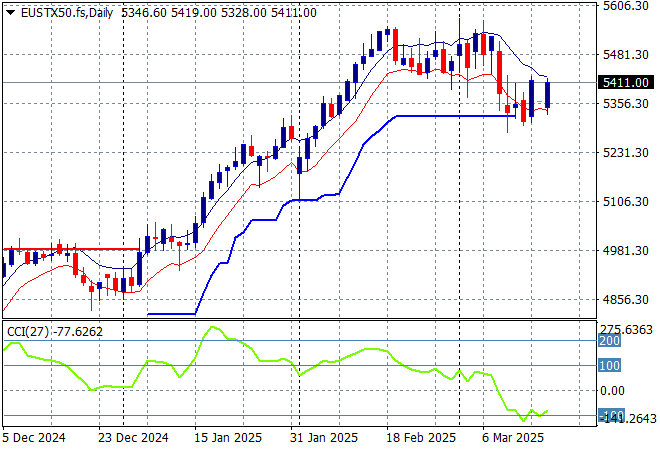
European markets were able to to continue their rebound after a series of falling sessions across the continent during last week, with the Eurostoxx 50 Index finishing 0.7% higher at 5444 points.
This was setting up for a breakdown with short term support taken out and the ATR support from the recent uptrend now under threat as momentum went into oversold mode but now looks like a new launching pad to buy more European defence stocks!
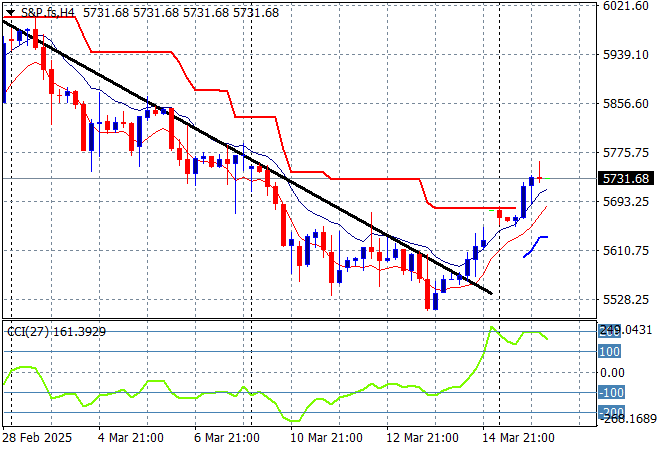
Wall Street was able to put in slightly more modest up sessions after its Friday night surge with the NASDAQ up 0.3% while the S&P500 did a lot better, moving 0.6% higher to close at 5675 points.
The Trump pump and dump scheme is working a treat here as overhead resistance rejected further calls to launch higher above that 6000 points throughout Jan and Feb with momentum now taking the market back to the September 2024 lows. But as I said last week watch for the bottom pickers here to keep this climbing:
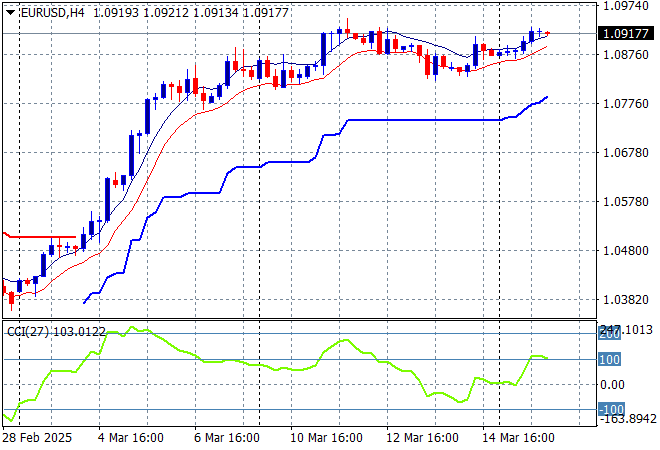
Currency markets remain strongly against King Dollar from the follow on from the weaker than expected US CPI print with Euro getting back on track to start the new trading week above the 1.09 level.
The union currency is still holding on despite the tariff trade war with short and medium term support building at higher levels. Momentum was overextended earlier in the week and has now re-engaged to the upside although a potential pullback move is waning here:
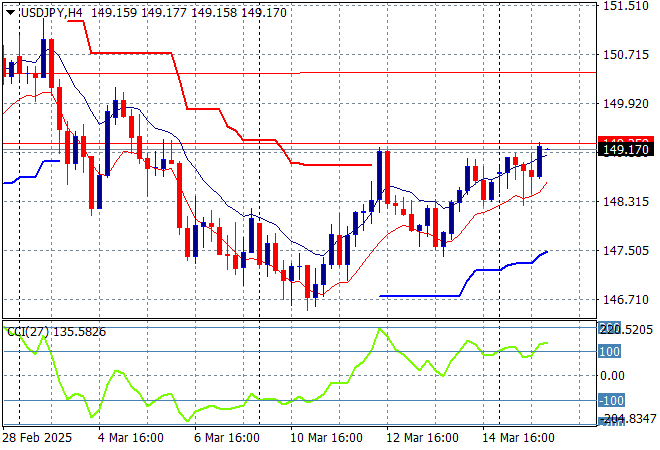
The USDJPY pair is doing better now to get out of its funk after a very brief deceleration phase into the early February lows around the 151 level with a matching session high overnight as it finally got back over the 149 level.
Short term momentum was extremely oversold before the start of week bounce but required price action to at least get over the 156 level to call this a proper trend higher. As USD weakens structurally overall and domestic policies continue to strengthen Yen watch for a potential return below the 146 level if the current resistance levels aren’t taken out:
The Australian dollar is trying hard to get back into the swing of things and we finally saw some life overnight as it surged past its previous weekly high point to almost hit the 64 cent level.
The recent follow through to the high 62’s and low 63’s was always high risk going into the live February RBA rate meeting and after the Trumpian tariff crusade although this bounceback has been able to shoot over the 200 day MA (moving black line). This has setup this new move higher which could have legs: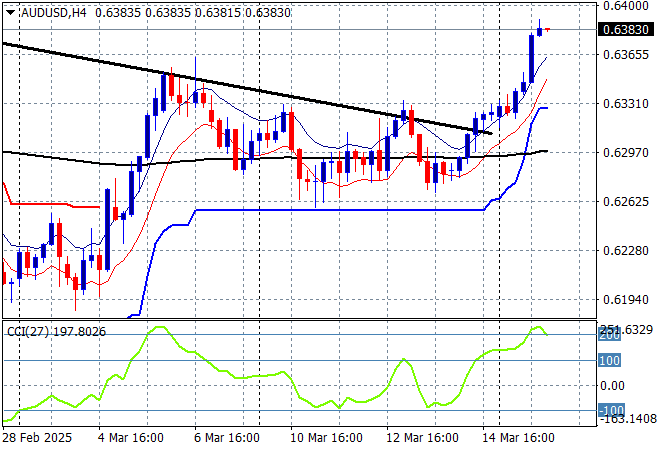
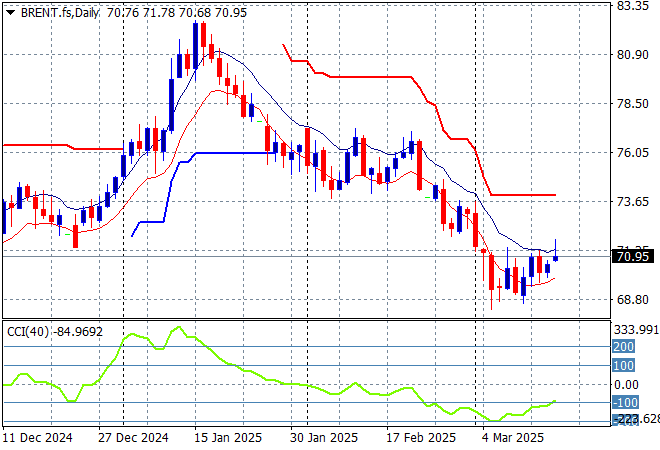
Oil markets are failing to get back on track as Brent crude struggled again overnight to make headway after recently showing some life above the $70USD per barrel level with another flat session instead.
The daily chart pattern shows the post New Year rally that got a little out of hand and now reverting back to the sideways lower action for the latter half of 2024. The potential for a return to the 2024 lows is building here, although news that the Ruzzians are facing more refinery attacks from the Ukrainians could see more buying support:
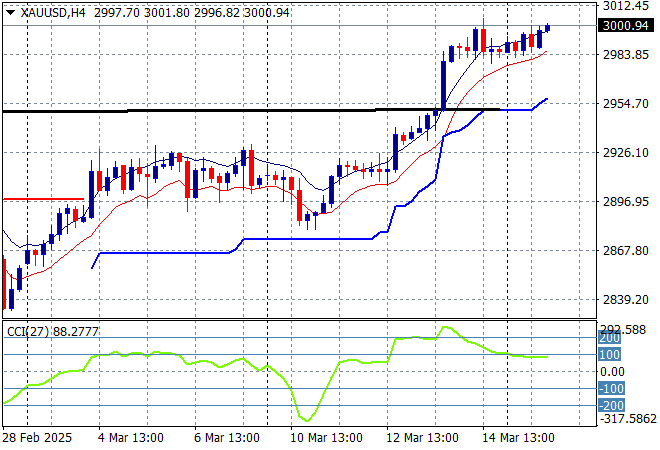
Gold finally did it this morning after it surge well above the $2950USD per ounce level in the previous session as it breached the $3000 level briefly!
Price action has always found a lot of resistance just under the $2960 zone so that was the likely target in any upside potential but that has been deftly pushed aside without any substantial pullback thereafter, finding a very solid bid up here at new historic highs:
Glossary of Acronyms and Technical Analysis Terms:
ATR: Average True Range – measures the degree of price volatility averaged over a time period
ATR Support/Resistance: a ratcheting mechanism that follows price below/above a trend, that if breached shows above average volatility
CCI: Commodity Channel Index: a momentum reading that calculates current price away from the statistical mean or “typical” price to indicate overbought (far above the mean) or oversold (far below the mean)
Low/High Moving Average: rolling mean of prices in this case, the low and high for the day/hour which creates a band around the actual price movement
FOMC: Federal Open Market Committee, monthly meeting of Federal Reserve regarding monetary policy (setting interest rates)
DOE: US Department of Energy
Uncle Point: or stop loss point, a level at which you’ve clearly been wrong on your position, so cry uncle and get out/wrong on your position, so cry uncle and get out!