
This timeline is getting crazier as Wall Street initially followed other stock markets in crash mode before rallying on fake tweets about nonsensical tariff pauses while Diaper Don spat his dummy about the Chinese counter tariffs while announcing “negotiations” with other countries were supposedly underway. The Europeans are being more strategic about things alongside the Canadians but the trade war is nowhere near over despite the bounceback this morning. The USD came back against the undollars after a surge in Treasury yields as recession fears continue to mount although Euro remains near the 1.09 handle, Yen has taken a back seat and the Australian dollar flails about wildly around the 60 cent level at a new five year low.
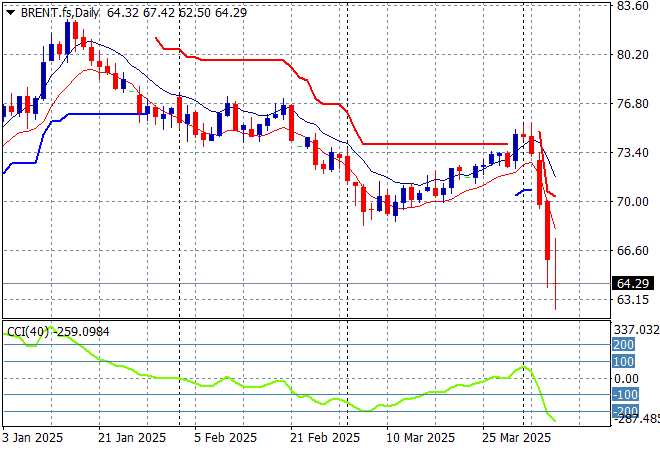
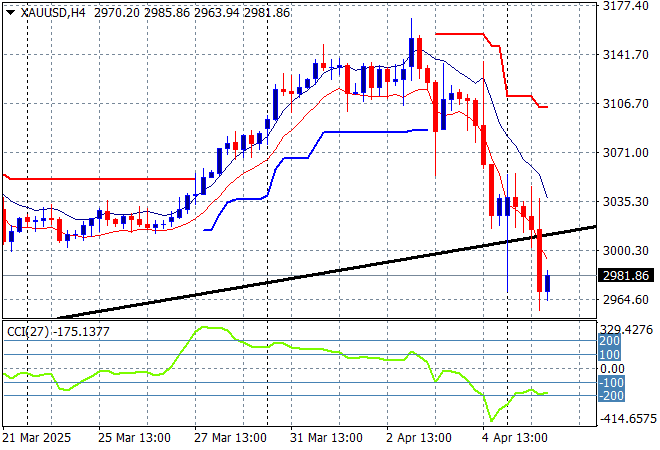
10 year Treasury yields surged 20 points to the 4.2% level as cashflows went into stocks while oil prices remain near their new lows, with Brent crude now down to the $64USD per barrel level. Gold also suffered further falls and finally retraced below the $3000USD per ounce level, currently at the $2985 area.
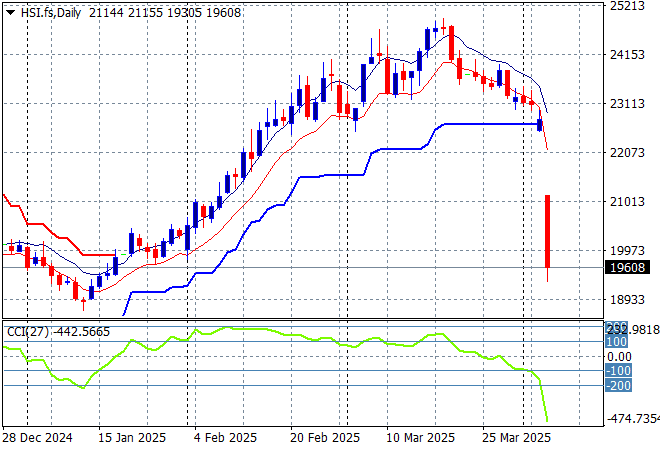
Looking at stock markets from Asia from yesterday’s session, where mainland and offshore Chinese share markets reopened in shocking fashion with the Shanghai Composite losing more than 7% to close below 3100 points while the Hang Seng Index plummeted more than 13%, closing at 19828 points.
The Hang Seng Index daily chart shows how this recent move looked unsustainable to the upside after recently setting up for another potential breakdown around the 20000 point level. Momentum has reversed completely to panic selling with support at the 22000 point level completely wiped out. More to come?
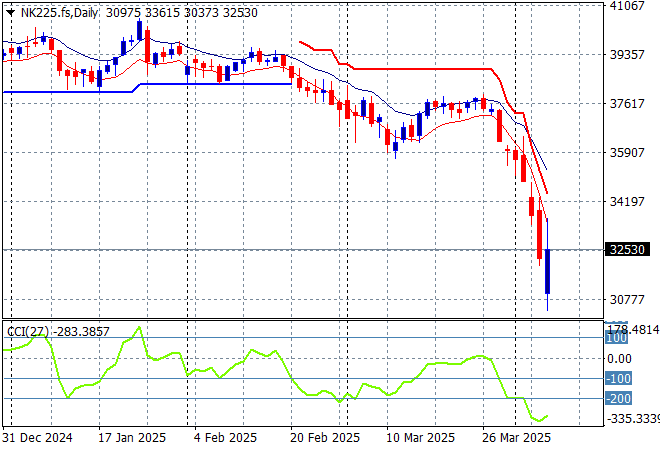
Japanese stock markets went limit down for awhile there with the Nikkei 225 eventually falling 7.8% to 3136 points.
Price action had been indicating a rounding top on the daily chart for sometime now with daily momentum retracing away from overbought readings with the breakout last month above the 40000 point level now in full remission. Yen volatility alongside correlation with other risk markets are the main problem here, although futures are indicating a bounce back on the open this morning:
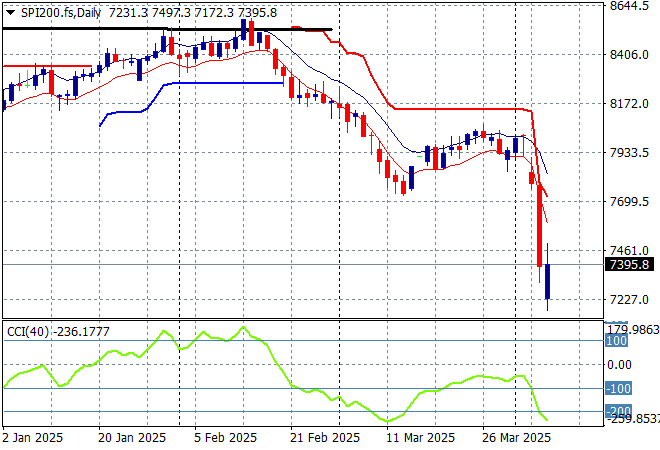
Australian stocks have not escaped the carnage with the ASX200 closing some 4% lower at 7346 points.
SPI futures are actually up 0.7% given the fake reversal on Wall Street from overnight so maybe some relief is on the way, for now. The daily chart pattern however suggests further downside is inevitable as the Chinese counter-counter tariffs take effect and the Australian dollar continues to crash but I expect a short covering bounce sometime soon…maybe:
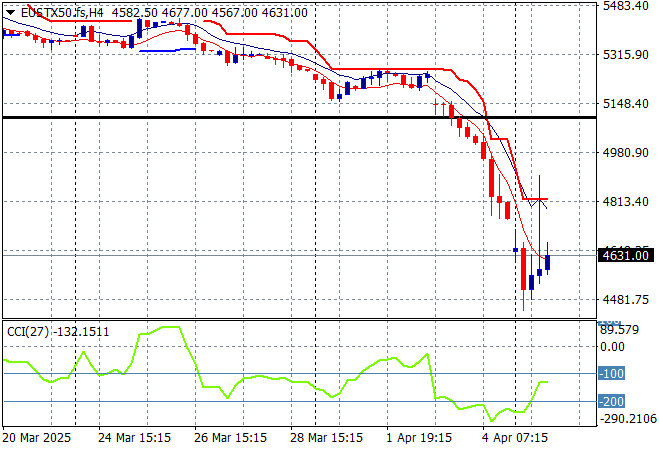
European markets were again unable to escape the widespread selling with big moves lower across the continent with the Eurostoxx 50 Index finishing down 4.6% to 4656 points.
Support at the previous monthly support levels (black line) at 5100 points failed to hold so 2024 lows at the 4400 point level are now in sight, baring a dead cat bounce here. Good time for more European defence stock purchases perhaps?
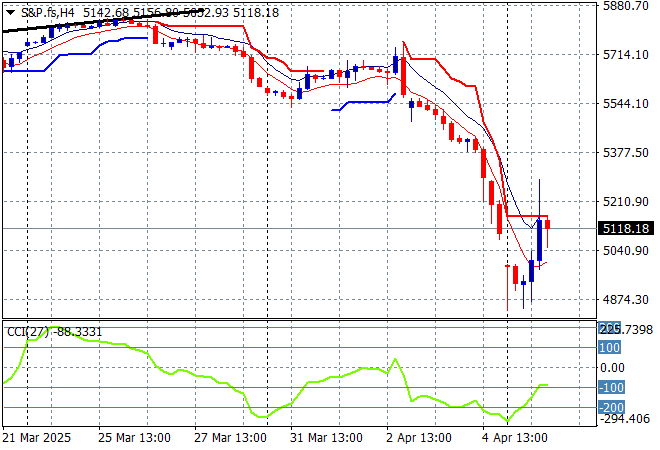
Wall Street saw further collapses initially before the fake news/tweet/White House nonsense saw a lot of shorts covered with the NASDAQ acatually putting on 0.1% while the S&P500 only lost 0.2% to eventually close at 5062 points.
The Trump pump and dump scheme is probably in dead cat bounce phase here as false hope builds that some relief is around the corner. Its not – this could go much lower with the former lows at the 5000 point level the area to watch:
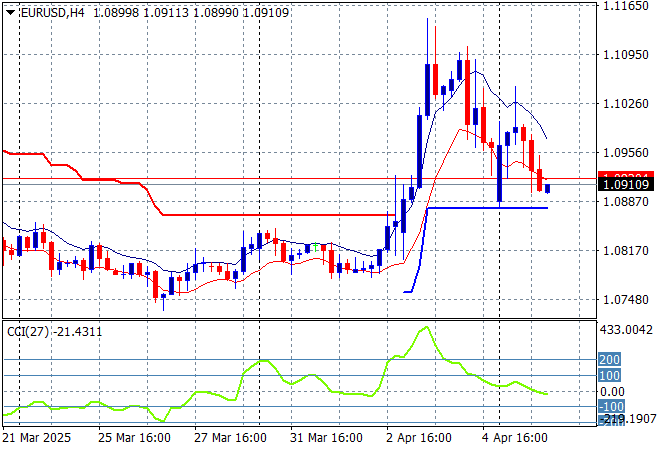
Currency markets are swinging back to “King” Dollar amid the volatility as China and other nations retaliate with Euro continuing its reversion back down to the 1.09 level with Pound Sterling pushed back to a four week low.
The union currency spiked up through the 1.11 handle before retracing in the previous session but couldn’t find support at the 1.10 level after the monthly US employment print on Friday and is now getting pushed back towards the 1.09 level proper where a new battle will be fought:
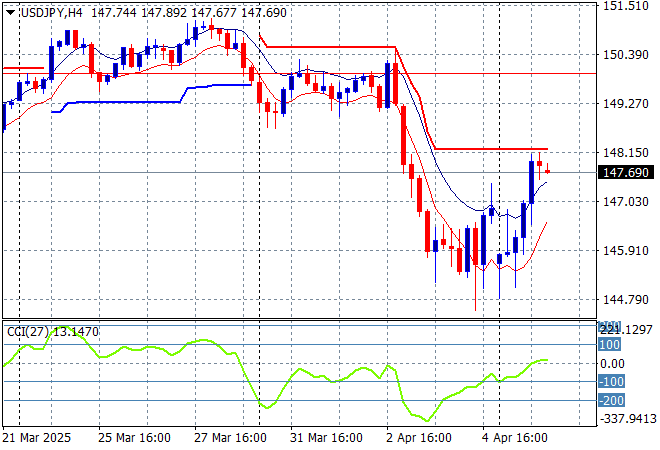
The USDJPY pair bounced back after its sharp decline, launching off the 145 handle to breach the 147 level before hitting short term resistance overhead.
Short term momentum was extremely oversold and showed a potential swing play here as everyone scratches their head to work out what’s going on with Japanese export industry likely to crumble unless some significant moves are made by the BOJ and Japanese government alongside China:
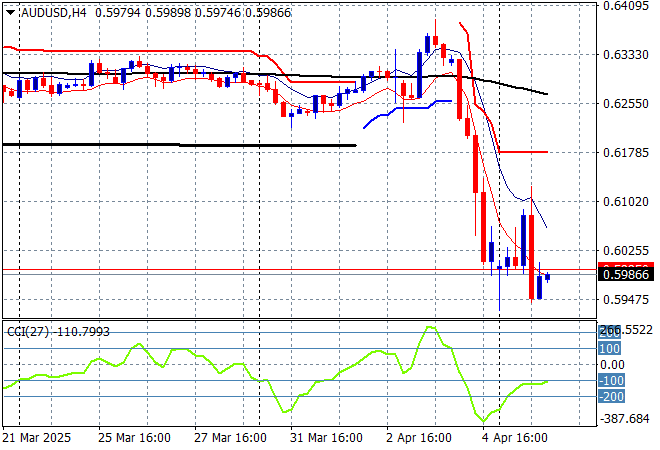
The Australian dollar continues to have a wild ride like other undollars but due to facing far more headwinds from commodity worries it lost a lot of ground on Friday night, and its starting down resistance forming at the 60 handle, as it fell to the mid 59 cent level overnight.
Stepping back for a longer point of view (and looking at the trusty AUDNZD weekly cross) price action is now solidly below the 200 day MA (moving black line) and a new five year low – yes we are back to COVID times. Here comes inflation!
Oil markets had finally broke out as they made positive headway all last week but the double whammy of an engineered US recession plus OPEC+ production increases are seeing the sharp reversal continue with Brent crude pushed below the $65USD per barrel level.
The daily chart pattern shows the post New Year rally that got a little out of hand and now reverting back to the sideways lower action for the latter half of 2024. The potential for a return to the 2024 lows was building here before this short term bounce and is now baked in :
Gold finally suffered some volatility which could be its correlation with silver, but also a large return to USD flows as the shiny metal fell sharply below the $3000USD per ounce level to breach its long term trendline.
Short term support hasn’t held here with the potential to springboard from here on USD weakness starting to falter as the main trendline is broken:
Glossary of Acronyms and Technical Analysis Terms:
ATR: Average True Range – measures the degree of price volatility averaged over a time period
ATR Support/Resistance: a ratcheting mechanism that follows price below/above a trend, that if breached shows above average volatility
CCI: Commodity Channel Index: a momentum reading that calculates current price away from the statistical mean or “typical” price to indicate overbought (far above the mean) or oversold (far below the mean)
Low/High Moving Average: rolling mean of prices in this case, the low and high for the day/hour which creates a band around the actual price movement
FOMC: Federal Open Market Committee, monthly meeting of Federal Reserve regarding monetary policy (setting interest rates)
DOE: US Department of Energy
Uncle Point: or stop loss point, a level at which you’ve clearly been wrong on your position, so cry uncle and get out/wrong on your position, so cry uncle and get out!