
The short covering rally on Wall Street quickly reversed as the insider traders made their profits while the rest of the risk complex gravely worked out that the end is still coming, 90 day stay of execution or not. The USD was shot down with its weakest one day performance in three years with a weaker than expected CPI print not helping as Euro, Swiss Franc, Pound Sterling – almost everything bid higher as the “King” slowly loses its reserve currency status. Bond markets however are still selling off with the dumping of US Treasuries continuing while the Australian dollar head up towards the 62 handle this morning as yet another increase in Chinese tariffs was announced by the Trump regime overnight.
10 year Treasury yields lifted again as they almost pushed through the 4.4% level with continued worrying signs on the long end of the curve while oil prices came back to reality with Brent crude pulling back to the $63USD per barrel level. Gold however made new highs after its recent surge above the $3000USD per ounce level, finishing at the $3170 area this morning before the Asian open.
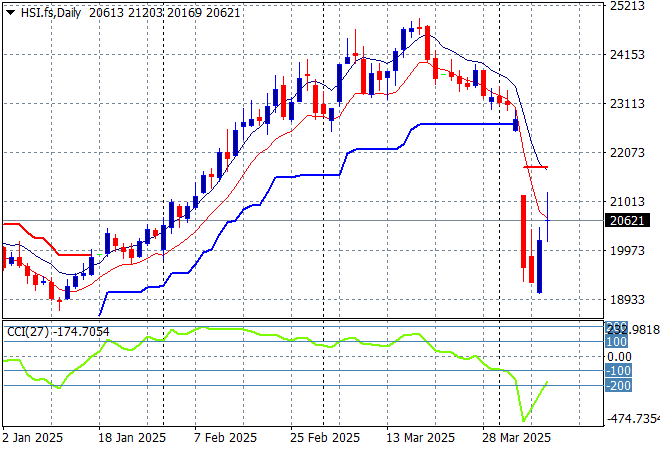
Looking at stock markets from Asia from yesterday’s session, where Chinese share markets moved higher in afternoon trade despite the major trade war with the US with the Shanghai Composite up 1% to extend above the 3200 point level while the Hang Seng Index pushed some 2% higher to 20681 points.
The Hang Seng Index daily chart shows how this recent move looked unsustainable to the upside after recently setting up for another potential breakdown around the 20000 point level. Momentum has reversed completely to panic selling with support at the 22000 point level completely wiped out. More to come?
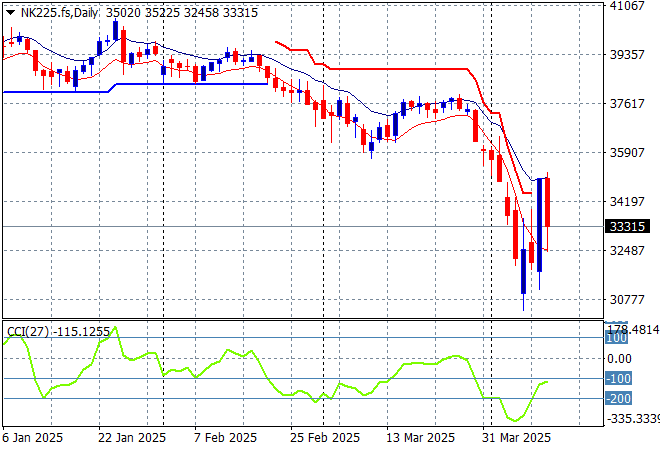
Japanese stock markets were the best performers however with the Nikkei 225 up more than 9% to 34609 points.
Price action had been indicating a rounding top on the daily chart for sometime now with daily momentum retracing away from overbought readings with the breakout last month above the 40000 point level now in full remission. Yen volatility alongside correlation with other risk markets are the main problem here, with futures are indicating another drop on the open this morning:
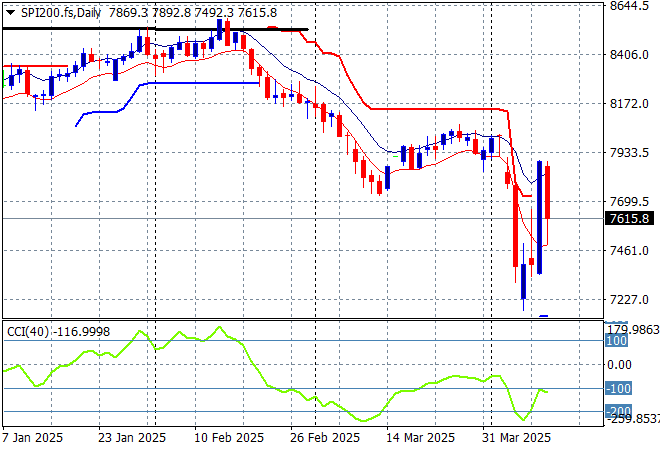
Australian stocks have had a big bounceback as well with the ASX200 closing 4.5% higher at 7709 points.
SPI futures are down 1.5% or more given yet another reversal of fortune on Wall Street from overnight. The daily chart pattern suggests further downside is inevitable as the Chinese counter-counter tariffs take effect but watch for a potential short covering rally back to 8000 points or so first:
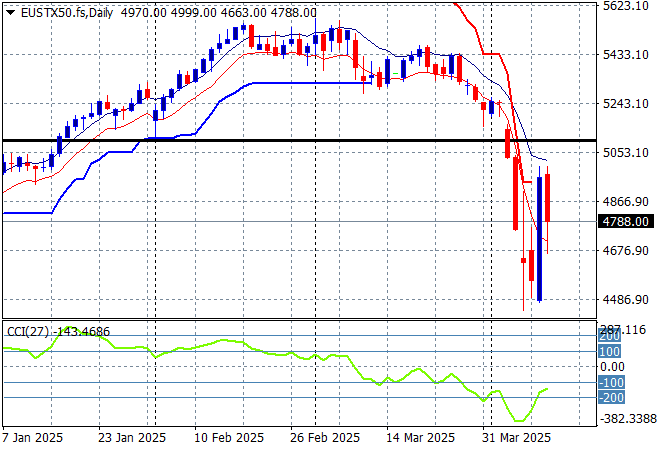
European markets were able to play catchup overnight with very strong moves higher across the continent with the Eurostoxx 50 Index finishing 4.2% higher at 4818 points but that will be shortlived as futures have reversed direction in line with the later falls on Wall Street.
Support at the previous monthly support levels (black line) at 5100 points failed to hold so 2024 lows at the 4400 point level are now in sight, baring a dead cat bounce here. Still a good time for more European defence stock purchases (almost):
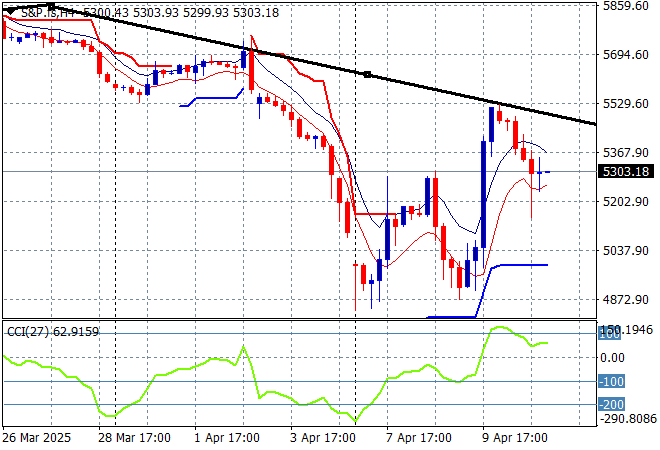
Wall Street was volatile – again – but this time to the downside as the insider traders at the White House and their associated goons made profit as everyone realised there’s still a major trade war going on with Chyna, with the NASDAQ losing more than 4% while the S&P500 lost 3.5% to eventually close below the 5300 point level.
The Trump pump and dump scheme moved out of its first dead cat bounce phase and into the “pump that cat full of steroids and see if it revives” stage, and now the roided cat is rolling over on the veterinarian’s table as realisation sets in that nothing can revive the failing US empire. I still contend we are going lower but 90 days is a LONG time with that fat idiot in the Oval Office:
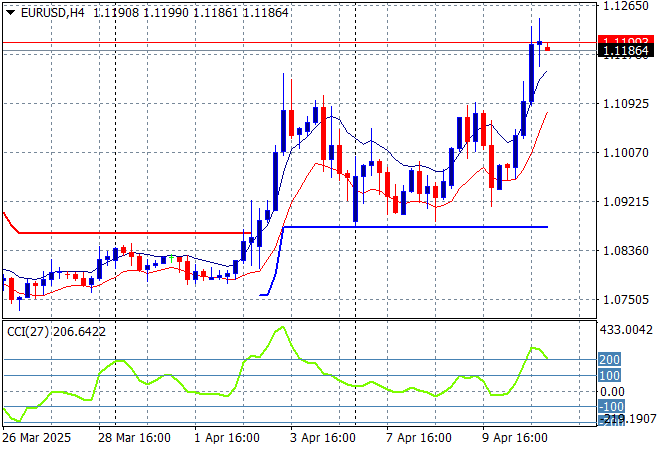
Currency markets became the most volatile among the risk complex with the US Dollar Index having its worst performance in three years as the USD slowly crumbles from its reserve currency status. The “King” is likely dead here with Euro breaking out to new highs to almost breach the 1.12 handle overnight.
The union currency spiked up through the 1.11 handle before retracing in the previous session but couldn’t find support at the 1.10 level after the monthly US employment print on Friday and is now getting pushed back towards the 1.09 level proper where a new battle will be fought:
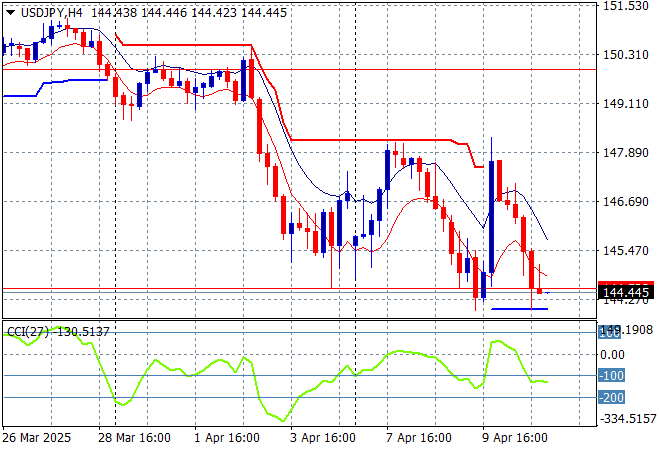
The USDJPY pair has made another sharp decline, after hitting short term resistance overhead at the 147 level, now matching its mid week lows at the 144 level.
Short term momentum was extremely oversold and showed a potential swing play here as everyone scratches their head to work out what’s going on with Japanese export industry likely to crumble unless some significant moves are made by the BOJ and Japanese government alongside China:
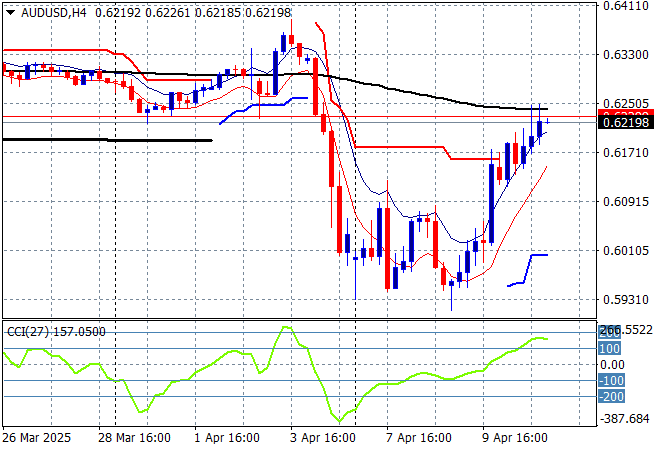
The Australian dollar continues to have a wild ride like everything else as it continued its bounceback overnight, soaring up through the 62 cent level.
Stepping back for a longer point of view (and looking at the trusty AUDNZD weekly cross) price action is still solidly below the 200 day MA (moving black line) and near new five year low. This is not yet over but watch for an attempt to get back to the 62 cent level in the short term first:
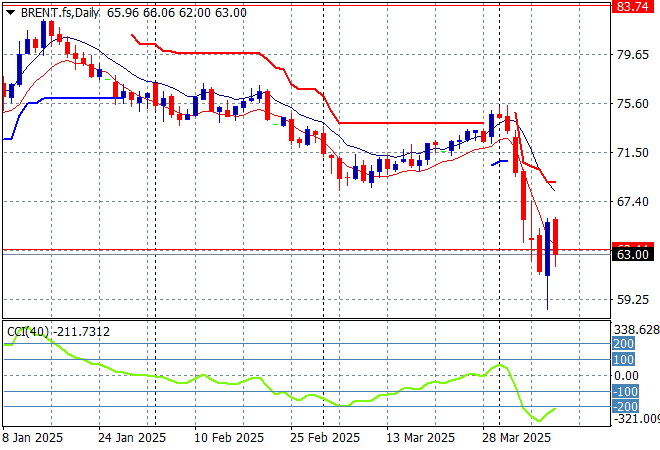
Oil markets couldn’t hold onto its bounce with Brent crude pushed back towards the $63USD per barrel level overnight.
The daily chart pattern shows the post New Year rally that got a little out of hand and now reverting back to the sideways lower action for the latter half of 2024. The potential for a return to the 2024 lows was building here before this short term bounce and is now baked in and then some as demand will collapse despite the very short term change in sentiment:
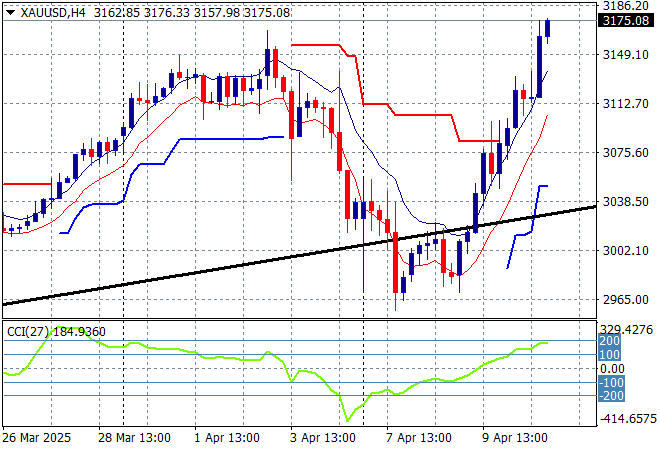
Gold is on track to make new record highs again, at least in USD terms as everyone snaffles up the shiny metal as it continued to zoom above the $3100USD per ounce level overnight.
Short term support has firmed immensely in recent sessions showing some real strength here and while momentum is considerably overbought we could see even more upside here with the $3200 area the next target to beat:
Glossary of Acronyms and Technical Analysis Terms:
ATR: Average True Range – measures the degree of price volatility averaged over a time period
ATR Support/Resistance: a ratcheting mechanism that follows price below/above a trend, that if breached shows above average volatility
CCI: Commodity Channel Index: a momentum reading that calculates current price away from the statistical mean or “typical” price to indicate overbought (far above the mean) or oversold (far below the mean)
Low/High Moving Average: rolling mean of prices in this case, the low and high for the day/hour which creates a band around the actual price movement
FOMC: Federal Open Market Committee, monthly meeting of Federal Reserve regarding monetary policy (setting interest rates)
DOE: US Department of Energy
Uncle Point: or stop loss point, a level at which you’ve clearly been wrong on your position, so cry uncle and get out/wrong on your position, so cry uncle and get out!