
One of the most volatile trading week’s has come and gone but all the signs remain that volatility is here to stay with weekend news that the “Art of the Deal” maker has already given up his key Trump card by exempting Chinese computers and smart phones from the 145% tariff slaps, while China is playing the longer game by halting rear earth supply. The short covering rally on Wall Street could continue for a little longer but the real action remains in bond and currency markets as the USD slowly loses its reserve currency status as Euro, Swiss Franc, Pound Sterling – almost everything continues to be bid higher. The Australian dollar is now heading up towards the 63 handle due to USD weakness.
Treasuries remain the key market to watch with 10 year yields surging again as they almost pushed through the 4.5% level for a near 50bps change last week. Oil prices are trying to recover but Brent crude is struggling to get back above the $65USD per barrel level. Gold however continues to make new highs after its recent surge above the $3000USD per ounce level, finishing above the $3200 area on Friday night.
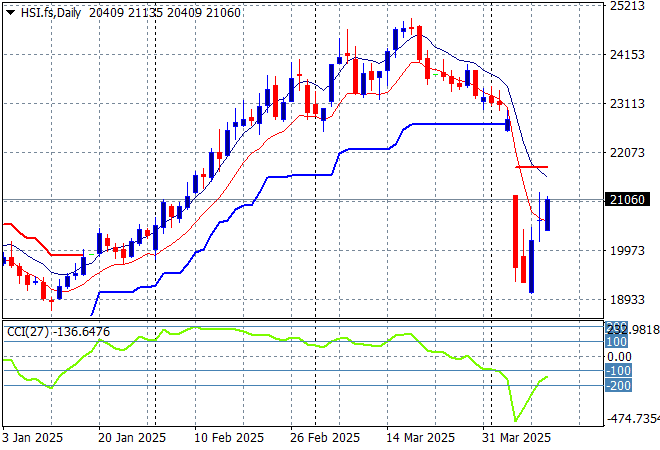
Looking at stock markets from Asia from Friday’s session, where mainland Chinese share markets were higher despite the major trade war with the US with the Shanghai Composite up 0.4% to extend above the 3200 point level while the Hang Seng Index was pushed some 1% higher to 20914 points.
The Hang Seng Index daily chart shows how this recent move looked unsustainable to the upside after recently setting up for another potential breakdown around the 20000 point level. Momentum has reversed completely to panic selling with support at the 22000 point level completely wiped out. More to come or is everything awesome:
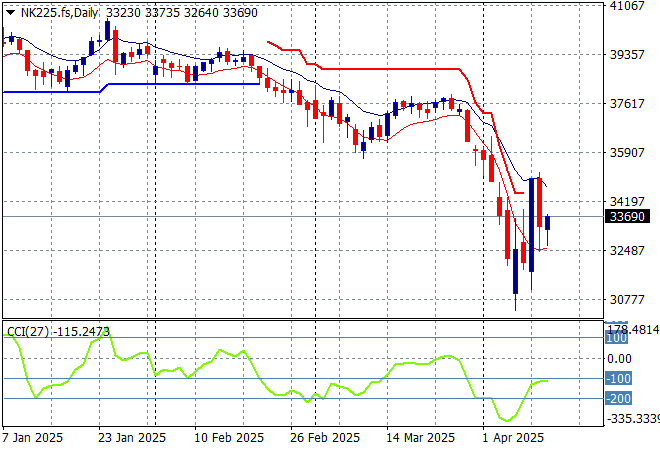
Japanese stock markets were the worst performers however with the Nikkei 225 down nearly 4% to 33584 points.
Price action had been indicating a rounding top on the daily chart for sometime now with daily momentum retracing away from overbought readings with the breakout last month above the 40000 point level now in full remission. Yen volatility alongside correlation with other risk markets are the main problem here, although futures are indicating another small bounce on the open this week:
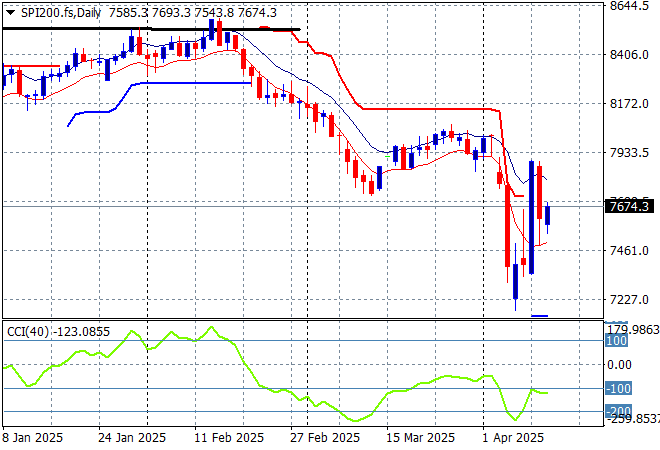
Australian stocks have pulled back the least with the ASX200 down just 1.3% at 7606 points.
SPI futures are up only 0.2% despite the rally Wall Street from Friday night as caution still reigns. The daily chart pattern suggests further downside is inevitable as the Chinese counter-counter tariffs take effect but watch for a potential short covering rally back to 8000 points or so first:
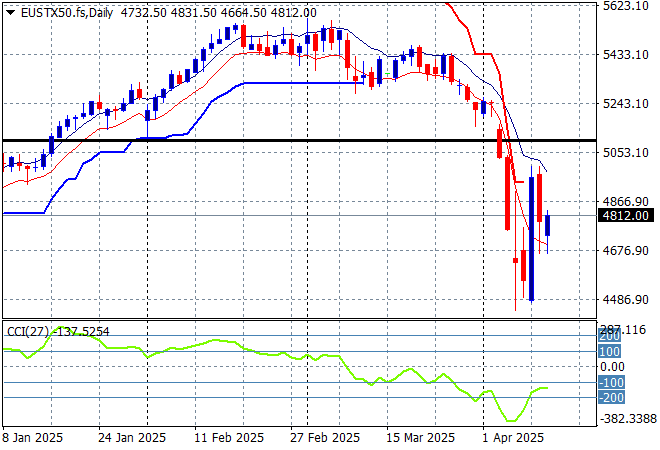
European markets were able to settle down a little on Friday night but it remains tenuous across the continent with the Eurostoxx 50 Index finishing 0.6% lower at 4787 points.
Support at the previous monthly support levels (black line) at 5100 points failed to hold so 2024 lows at the 4400 point level are now in sight, baring a dead cat bounce here. Still a good time for more European defence stock purchases (almost):
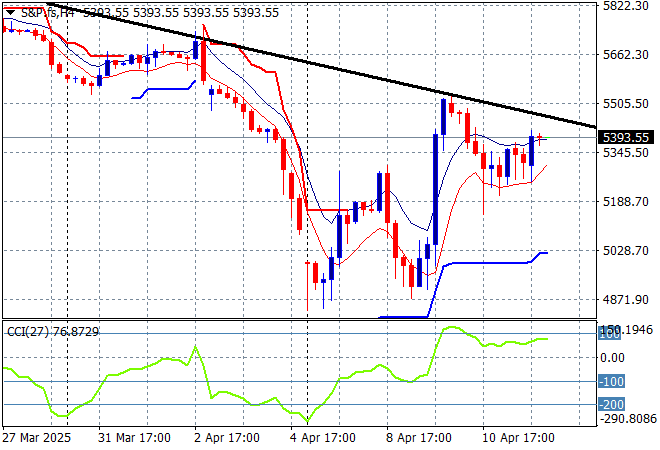
Wall Street was volatile to the upside again with NASDAQ gaining more than 2% while the S&P500 pushed nearly 2% higher as well to eventually close at the 5363 point level.
The Trump pump and dump scheme moved out of its first dead cat bounce phase and into the “pump that cat full of steroids and see if it revives” stage, and now the roided cat is rolling over on the veterinarian’s table as realisation sets in that nothing can revive the failing US empire. I still contend we are going lower but 90 days is a LONG time with that fat idiot in the Oval Office:
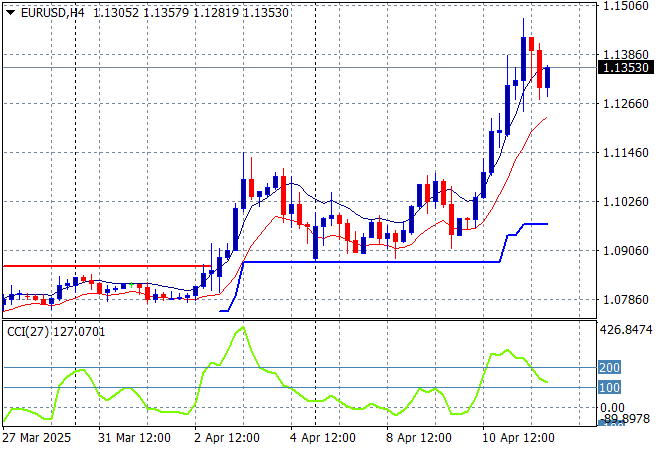
Currency markets are pushing the US Dollar Index down considerably with a 1.5% drop against the Kiwi really highlighting how badly things are going for the “King”. Euro broke out to new highs again to breach the 1.13 handle on Friday night but looks set to zoom past the 1.15 handle next.
The union currency spiked up through the 1.11 handle mid week before retracing in the previous session but is finding straight support at that level now to springboard higher although it is considerably overbought and has to navigate quite a few releases coming up this week:
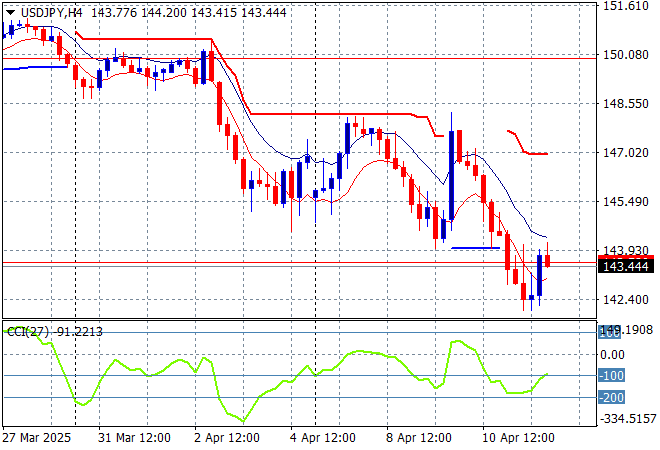
The USDJPY pair has made another sharp decline, after hitting short term resistance overhead at the 147 level, now pushing below its mid week lows to settle at the 143 level.
Short term momentum was extremely oversold and showed a potential swing play here but that has disappeared as Yen can only go higher as the USD is dumped amid a new trade bloc forming in the Asia-Pacific with the US:
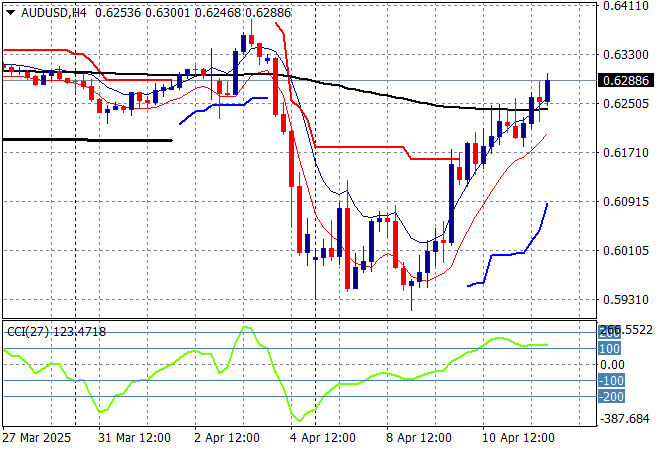
The Australian dollar continues to have a wild ride like everything else as it continued its bounceback on Friday night, extending above the 62 cent level to actually get back to the pre-tariff levels.
Stepping back for a longer point of view (and looking at the trusty AUDNZD weekly cross) price action is still solidly below the 200 day MA (moving black line) and near new five year low. This is not yet over but watch for an attempt to get back to the 63 cent level in the short term first:
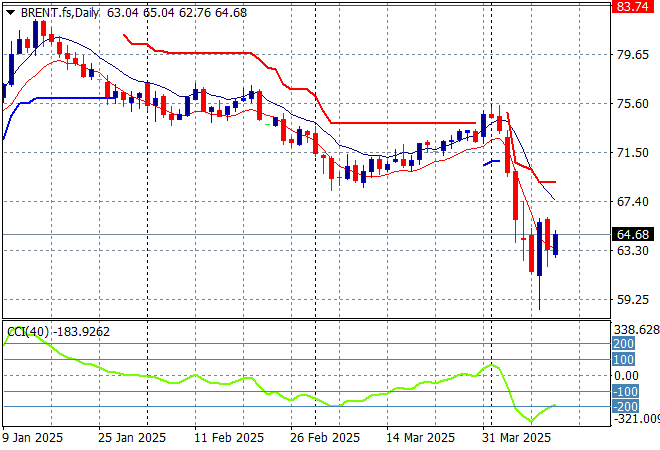
Oil markets are trying hard to hold onto its post tariff pause bounce with Brent crude remaining below the $65USD per barrel level on Friday night.
The daily chart pattern shows the post New Year rally that got a little out of hand and now reverting back to the sideways lower action for the latter half of 2024. The potential for a return to the 2024 lows was building here before this short term bounce and is now baked in and then some as demand will collapse despite the very short term change in sentiment:
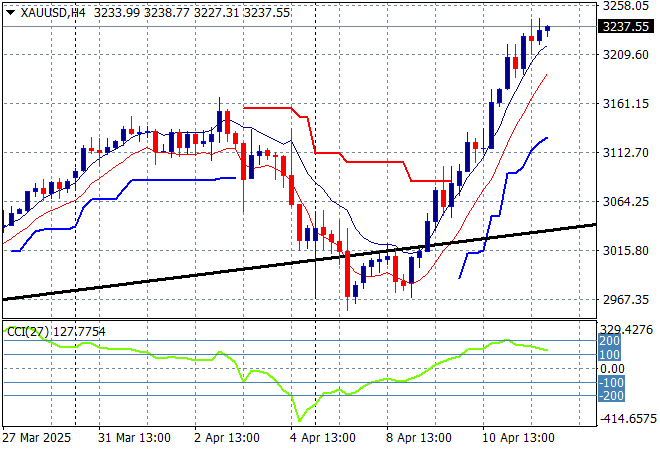
Gold is making new record highs again, at least in USD terms as everyone snaffles up the shiny metal as it zoomed above the $3200USD per ounce level on Friday night with a small slowdown at the end of the session.
Short term support has firmed immensely in recent sessions showing some real strength here and while momentum is considerably overbought we could see even more upside here with the $3200 area likely to hold here with a small dip on profit taking:
Glossary of Acronyms and Technical Analysis Terms:
ATR: Average True Range – measures the degree of price volatility averaged over a time period
ATR Support/Resistance: a ratcheting mechanism that follows price below/above a trend, that if breached shows above average volatility
CCI: Commodity Channel Index: a momentum reading that calculates current price away from the statistical mean or “typical” price to indicate overbought (far above the mean) or oversold (far below the mean)
Low/High Moving Average: rolling mean of prices in this case, the low and high for the day/hour which creates a band around the actual price movement
FOMC: Federal Open Market Committee, monthly meeting of Federal Reserve regarding monetary policy (setting interest rates)
DOE: US Department of Energy
Uncle Point: or stop loss point, a level at which you’ve clearly been wrong on your position, so cry uncle and get out/wrong on your position, so cry uncle and get out!