
Risk sentiment continued its decline over the Easter weekend with Wall Street snapping back nearly 3% lower overnight as it appears all the puffery around trade deals from the Trump regime is exactly that – hot air!
Currency and bond markets are broadcasting fairly clearly now that the global trade and financial system is reeling in the wake of the tariffs with the widening trade war between China and the US gathering pace. The next threat that is looming is the potential firing of Fed Chair Powell by Trump with the USD sold off to new lows again overnight with Euro now above the 1.15 handle while the Australian dollar is pushing above the 64 level alongside a resurgent Kiwi.
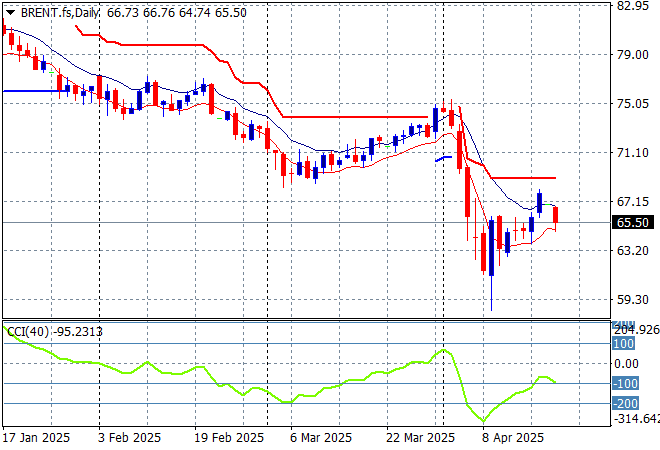
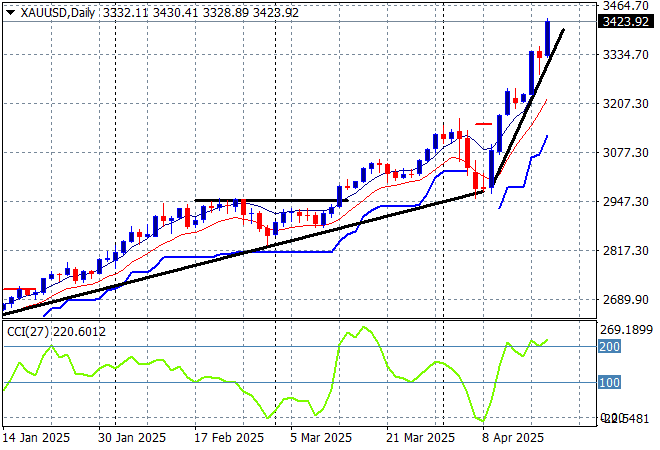
Oil prices are failing to build some support with Brent crude retracing back to the $65USD per barrel level while gold had another huge surge over the weekend, up another $100USD per ounce higher to breach a new record high above the $3400USD per ounce level.
Looking at stock markets from Asia from yesterday’s session, where mainland Chinese share markets were able to move slightly higher with the Shanghai Composite almost above the 3300 point level while the Hang Seng Index was closed for a holiday.
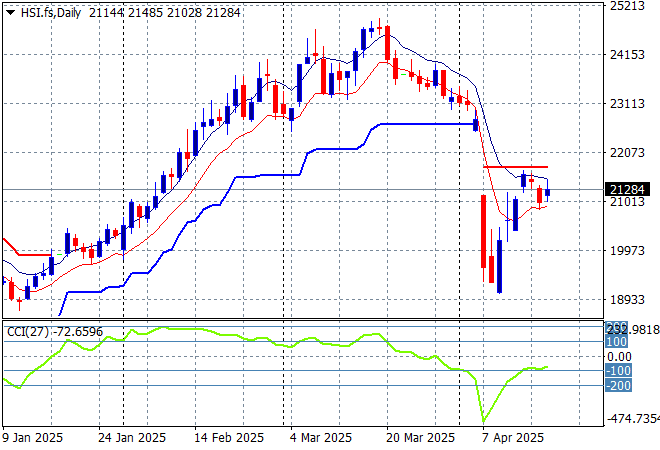
The Hang Seng Index daily chart shows a classic dead cat bounce setup following the collapse below the 20000 point level, with the rollover not yet in place despite the trade war with the US. This may recommence on the open today so watch for any falls below the 21000 point level:
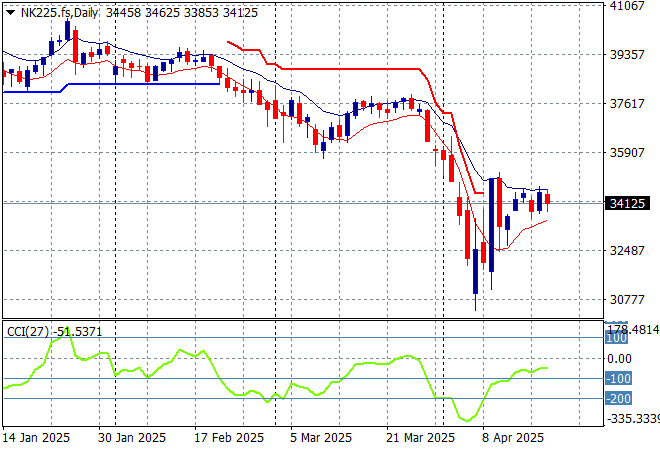
Japanese stock markets slipped yesterday with the Nikkei 225 down over 1.3% to 34237 points.
Price action is also displaying a classic dead cat bounce pattern with daily momentum unable to get back into positive readings nor push through former support, now resistance at the 36000 point level. Futures are indicating a retracement on the open this morning:
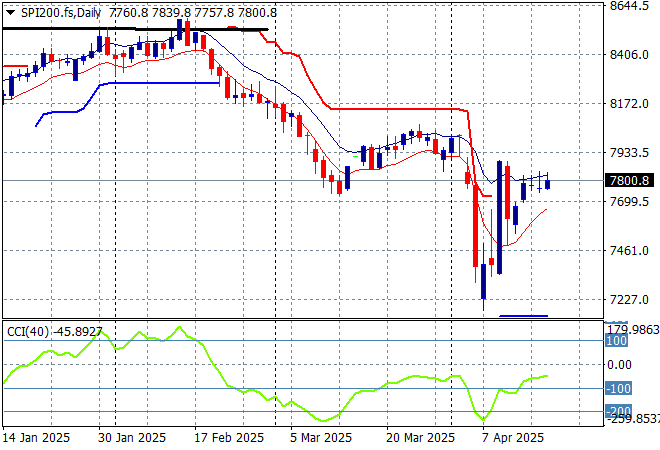
Australian stocks were closed for the Easter long weekend. However SPI futures are steady in anticipation of a probable rough open this morning in response to the overnight sharp selling on Wall Street.
The daily chart pattern suggests further downside is inevitable as the Chinese counter-counter tariffs take effect but watch for a potential short covering rally back to 8000 points or so first, but it seems the writing is on the wall:
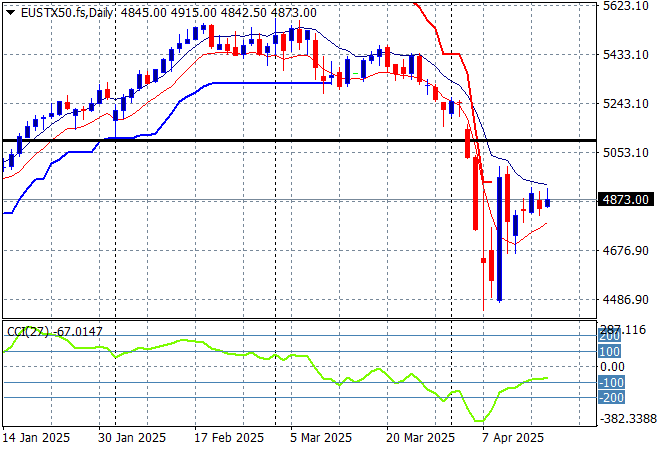
European markets were also mainly closed for the long weekend with Eurostoxx 50 Index futures also flat lining overnight.
Support at the previous monthly support levels (black line) at 5100 points failed to hold so 2024 lows at the 4400 point level are still in sight, with yet another dead cat bounce which seems to be forming here:
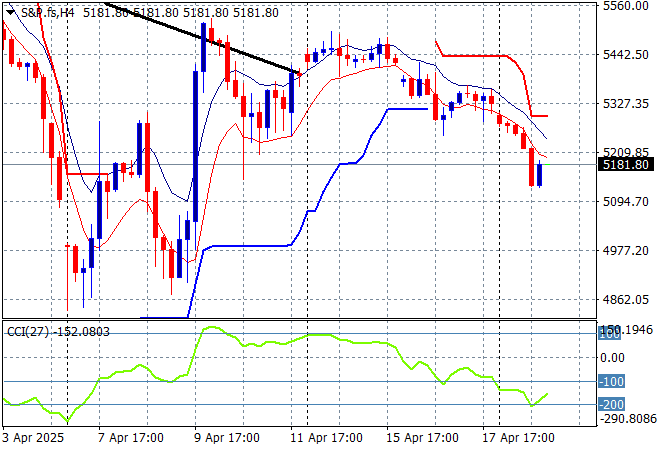
Wall Street is showing the way as its dead cat with a bad combover rolls over as the NASDAQ and the S&P500 were both pushed nearly 2.5% lower with the latter eventually closing at the 5158 point level.
This is not looking good as the short term and medium term charts are pointing to a resumption of selling back below the 5000 point psychological barrier as the tariff impacts start to make themselves felt in earnings. Tonight’s TSLA earnings will be very interesting!
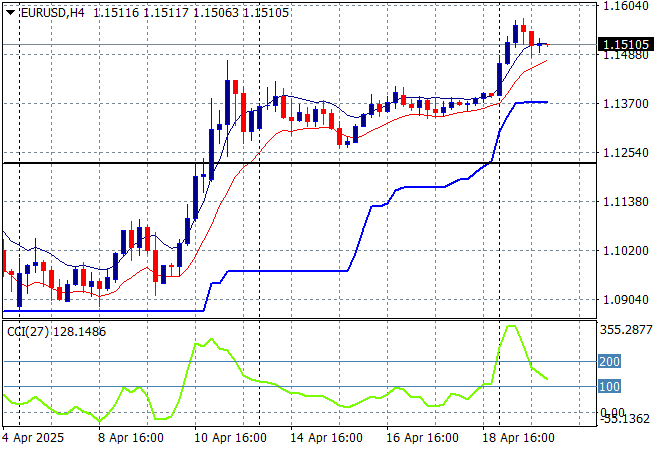
Currency markets are still wanting to push the US Dollar down with Euro getting back on track overnight to push above the 1.15 handle as the latest comments about Fed Chair Powell did not help US stocks or USD holders at all.
The union currency spiked up through the 1.12 handle last week as is finding strong support at that level now to springboard higher although it is considerably overbought and has to navigate quite a few releases coming up this week, but the longer term trend seems to be undollar across the board:
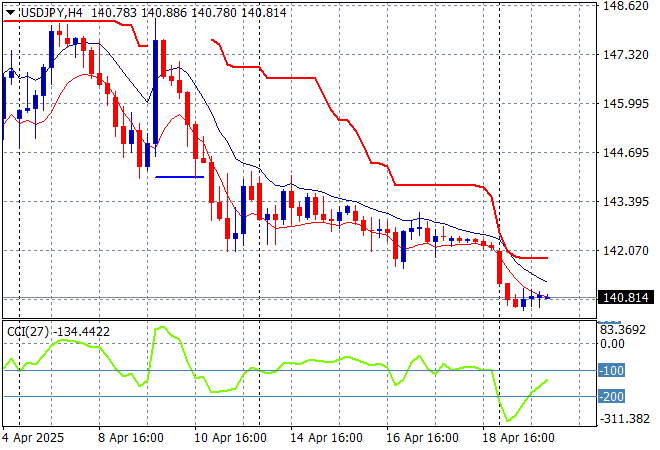
The USDJPY pair failed to hold at its recent lows after settling at the 143 level without any upside potential building as it now rolls over below the 141 level overnight.
Short term momentum was extremely oversold and showed a potential swing play here but that has disappeared as Yen can only go higher as the USD is dumped amid a new trade bloc forming in the Asia-Pacific with the US. Watch for any sustained break below the 139 level next which completes a multi year bearish head and shoulders setup that could see the 110 to 120 level revisited:
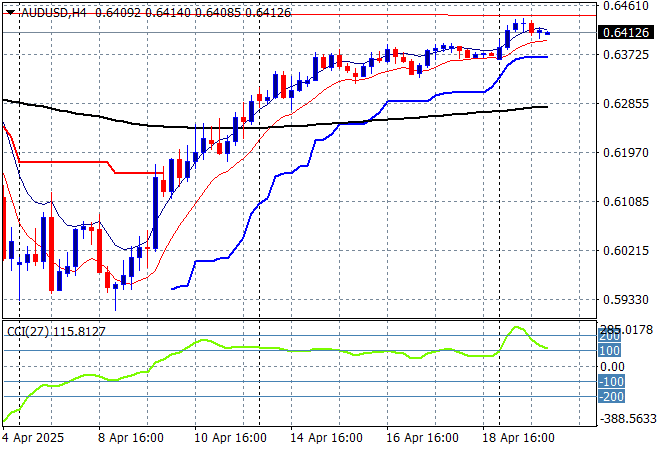
The Australian dollar is slowly extending its gains with a further move above the 64 cent level to extend above the pre-tariff announcement levels, although short term momentum is slowing down a little bit here.
Stepping back for a longer point of view (and looking at the trusty AUDNZD weekly cross) price action has crossed back above the 200 day MA (moving black line) after bouncing off a near new five year low. This is all about the USD, not the Australian economy so I’m wary here but you’ve got to follow price, keeping an eye on temporary support at the 63 cent level:
Oil markets are trying hard to hold onto its post tariff pause bounce with Brent crude retracing back down to the $65USD per barrel level after the weekend gap.
The daily chart pattern shows the post New Year rally that got a little out of hand and now reverting back to the sideways lower action for the latter half of 2024. The potential for a return to the 2024 lows is still building here as domestic demand in the US is likely to collapse despite the very short term change in sentiment:
Gold zoomed up above the $3200USD per ounce level last week with a very mild pullback after the weekend gap but has now managed to zoom up through the $3400 level as of this morning as internal support remains very strong in what looks like a bubble!
Short term support has firmed immensely in recent sessions showing some real strength here and while momentum is considerably overbought we could see even more upside here as the run on USD may only just be getting started:
Glossary of Acronyms and Technical Analysis Terms:
ATR: Average True Range – measures the degree of price volatility averaged over a time period
ATR Support/Resistance: a ratcheting mechanism that follows price below/above a trend, that if breached shows above average volatility
CCI: Commodity Channel Index: a momentum reading that calculates current price away from the statistical mean or “typical” price to indicate overbought (far above the mean) or oversold (far below the mean)
Low/High Moving Average: rolling mean of prices in this case, the low and high for the day/hour which creates a band around the actual price movement
FOMC: Federal Open Market Committee, monthly meeting of Federal Reserve regarding monetary policy (setting interest rates)
DOE: US Department of Energy
Uncle Point: or stop loss point, a level at which you’ve clearly been wrong on your position, so cry uncle and get out/wrong on your position, so cry uncle and get out!