
Wall Street ended the trading week on a strong note, continuing the rebound from recent lows after more flopping on tariffs from the Trump regime however a weekend Time interview and further comments out of the White House could unsettle markets again. Friday night saw European stocks also lift higher while the USD firmed against the undollars, particularly Yen and Kiwi.
However, bond markets remain somewhat in flux with the 10 year Treasury yield back below the 4.3% level while oil prices are failing to build support with Brent crude pushed back towards the $65USD per barrel level yet again. Meanwhile gold is still suffering somewhat from resurgent USD strength, but was able to settle above the $3300USD per ounce level.
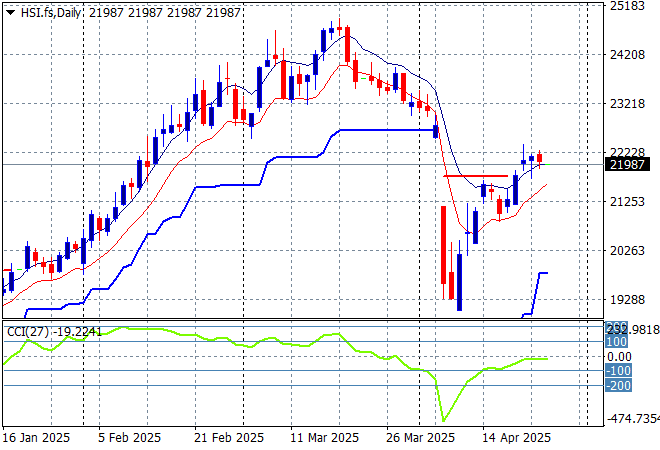
Looking at stock markets from Asia from Friday’s session, where mainland Chinese share markets were slightly lower with the Shanghai Composite just closing below the 3300 point level in a flat session while the Hang Seng Index initially pulled back around 1% before a late recovery to close 0.3% higher to remain just below the 22000 point level.
The Hang Seng Index daily chart shows a classic dead cat bounce setup following the collapse below the 20000 point level, with the rollover not yet in place despite the trade war with the US. This looks like a potential rally if traders can believe the headlines:
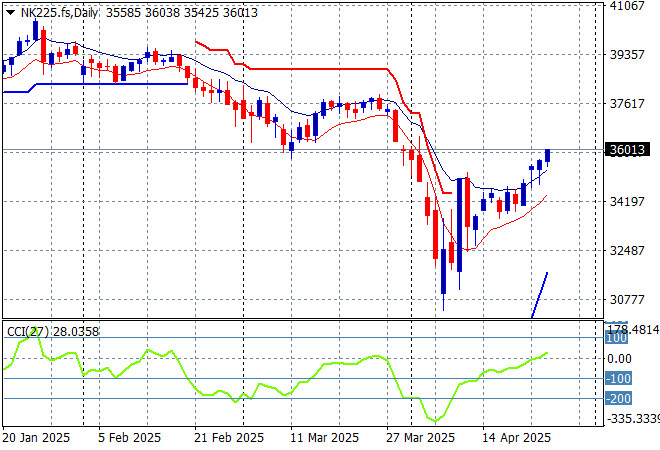
Japanese stock markets are also doing well with the Nikkei 225 up nearly 0.4% to 35001 points.
Price action is also displaying a classic dead cat bounce pattern but daily momentum has been able to get back into positive readings and is now challenging resistance at the 36000 point level. Futures are indicating a further lift on the open this morning:
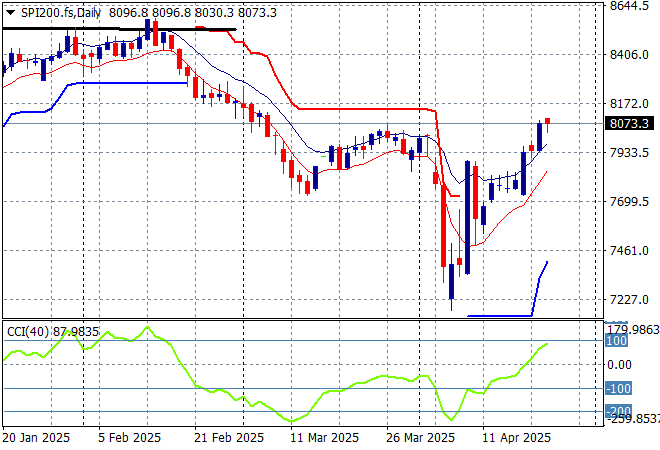
Australian stocks managed a solid session with the ASX200 up nearly 0.7% at 7968 points.
SPI futures are indicating a small rise on the open given the small rally on Wall Street from Friday night. The daily chart pattern suggests further downside could be inevitable as the Chinese counter-counter tariffs take effect but watch for a potential short covering rally back to 8000 points or so first with resistance at the 8200 the real level to beat:
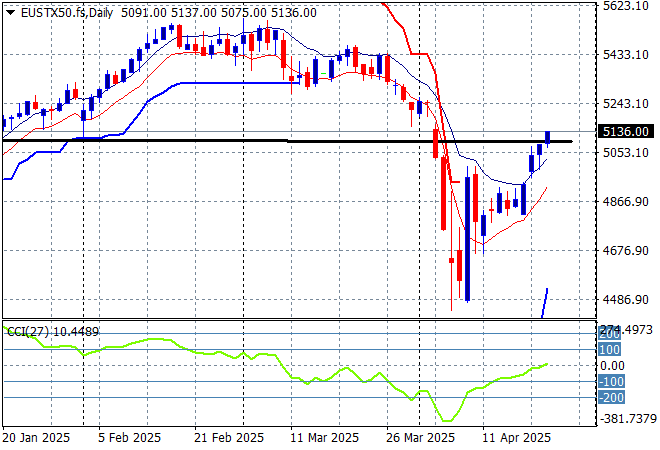
European markets also continued their rebound across the continent with the Eurostoxx 50 Index closing nearly 0.8% higher at 5154 points.
Support at the previous monthly support levels (black line) at 5100 points failed to hold so 2024 lows at the 4400 point level are still in sight, but there maybe life yet in this dead cat bounce:
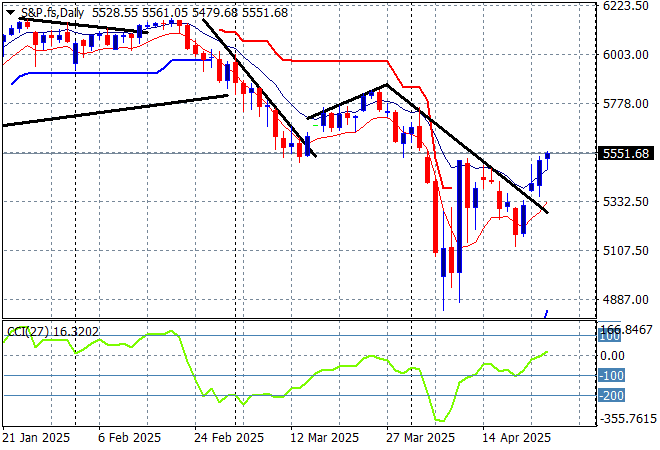
Wall Street continues to buy into the delusion that everything is awesome with the NASDAQ up more than 1% while the S&P500 pushed nearly 0.8% higher to close at the 5525 point level.
This was not looking good as the short term and medium term charts are pointing to a resumption of selling back below the 5000 point psychological barrier as the tariff impacts start to make themselves felt in earnings but this market is beholden to the Headline Man – look at me! I’m waving my hands so buy buy buy the dip!
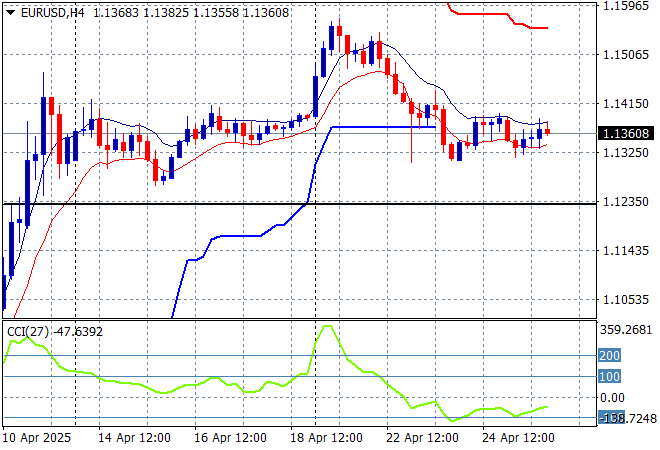
Currency markets are still trying to understand fact from fiction but the USD bid is too strong to ignore now with a continued return to strength after several weeks of weakness although Euro is firming at the 1.13 handle after being considerably overbought in recent sessions.
The union currency spiked up through the 1.13 handle last week, before pushing through a big volatile spike above the 1.15 handle over the Easter break before this pullback. The longer term trend still seems to be undollar across the board but watch for support to bounce back at the 1.12 level which corresponds to the 2023 and 2024 highs:
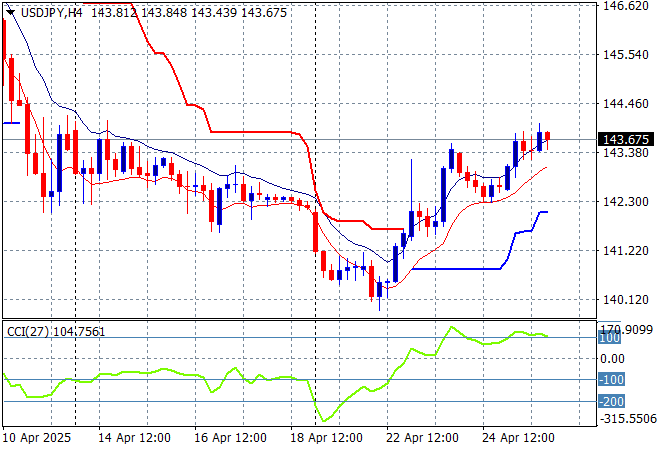
The USDJPY pair continues to launch higher with a push through the 143 handle on Friday night after bounce off last weeks lows in a sharp reversal.
Watch for any sustained break below the 139 level next which completes a multi year bearish head and shoulders setup that could see the 110 to 120 level revisited but in the short term the high volatility around USD could see a rally back up to the mid 144 level:
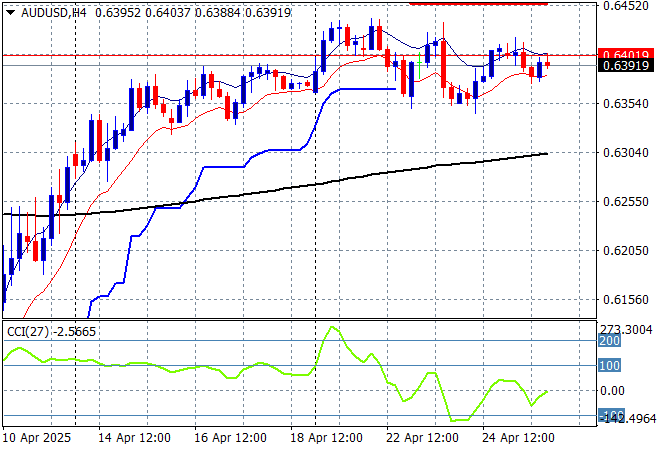
The Australian dollar was previously slowly extending its gains above the 64 cent level to extend above the pre-tariff announcement levels, but remains somewhat firm here despite not making a new high for over a week.
Stepping back for a longer point of view (and looking at the trusty AUDNZD weekly cross) price action has crossed back above the 200 day MA (moving black line) after bouncing off a near new five year low. This is all about the USD, not the Australian economy so I’m wary here but you’ve got to follow price, keeping an eye on temporary support at the 63 cent level:
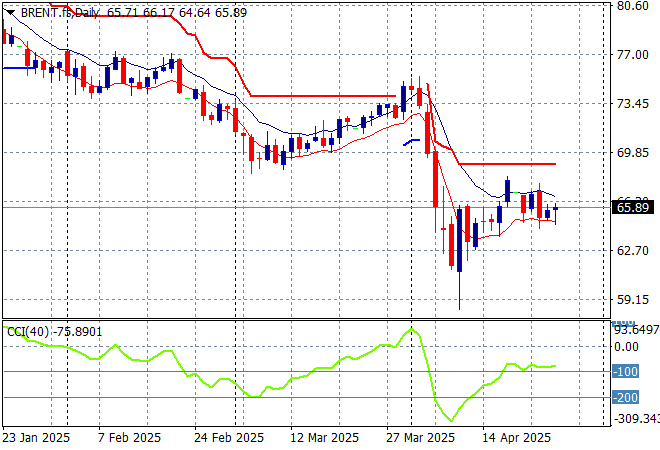
Oil markets are trying hard to hold onto its post tariff pause bounce but are facing other geopolitical ructions with Brent crude pulling back to the $65USD per barrel level to match its start of week position following the weekend gap.
The daily chart pattern shows the post New Year rally that got a little out of hand and now reverting back to the sideways lower action for the latter half of 2024. The potential for a return to the 2024 lows is still building here as domestic demand in the US is likely to collapse despite the very short term change in sentiment:
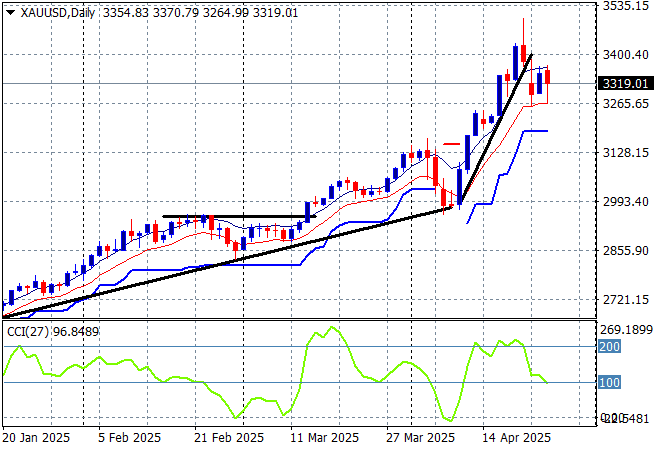
Gold pulled back somewhat on Friday night after sharply moving higher in recent weeks as it got way ahead of itself at least on the short term charts finishing at the $3300USD per ounce level.
Short term support had firmed immensely in recent sessions showing real strength but momentum became considerably overbought so this was inevitable as price action has reverted back to the uptrend line from the April lows. There is further support at the $3200 level that could be tested next on the overshoot:
Glossary of Acronyms and Technical Analysis Terms:
ATR: Average True Range – measures the degree of price volatility averaged over a time period
ATR Support/Resistance: a ratcheting mechanism that follows price below/above a trend, that if breached shows above average volatility
CCI: Commodity Channel Index: a momentum reading that calculates current price away from the statistical mean or “typical” price to indicate overbought (far above the mean) or oversold (far below the mean)
Low/High Moving Average: rolling mean of prices in this case, the low and high for the day/hour which creates a band around the actual price movement
FOMC: Federal Open Market Committee, monthly meeting of Federal Reserve regarding monetary policy (setting interest rates)
DOE: US Department of Energy
Uncle Point: or stop loss point, a level at which you’ve clearly been wrong on your position, so cry uncle and get out/wrong on your position, so cry uncle and get out!