
An uneasy night on Wall Street with minor moves as more earnings reports filter through amid more bluster from the Trump regime about nonexistent Chines tariff negotiations helping push USD lower against most of the majors as Pound Sterling hits a new three year high amid a UK/EU detente on trade. The Canadian Loonie remains in flux amid the election outcome while the Australian dollar is firming up as well to extend further above the 64 cent level.
10 year Treasury yields are slipping again with a move back below the 4.3% level while oil prices are failing to build support with Brent crude pushed below the $65USD per barrel level again. Meanwhile gold is trying to recover as it builds further above the $3300USD per ounce level amid general USD weakness.
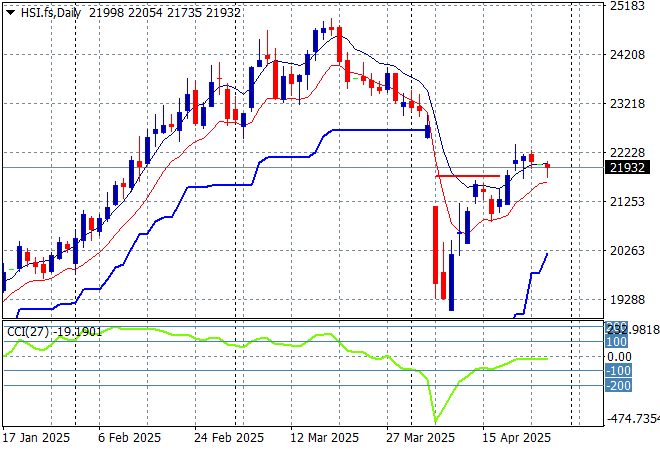
Looking at stock markets from Asia from yesterday’s session, where mainland Chinese share markets were slightly lower with the Shanghai Composite to close below the 3300 point level in a flat session while the Hang Seng Index initially pulled back initially before recovering with a flat session to remain just below the 22000 point level.
The Hang Seng Index daily chart shows a classic dead cat bounce setup following the collapse below the 20000 point level, with the rollover not yet in place despite the trade war with the US. This looks like a potential rally if traders can believe the headlines but needs to firmly move above the 22000 point area to clear local resistance:
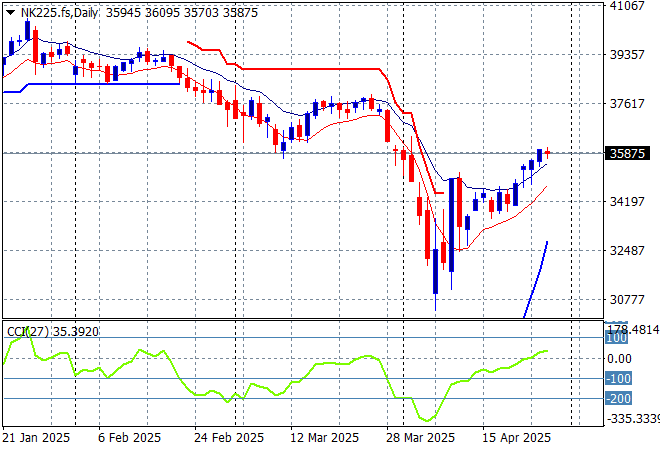
Japanese stock markets were able to do somewhat better with the Nikkei 225 up nearly 0.4% to 35839 points.
Price action was also displaying a classic dead cat bounce pattern but daily momentum has been able to get back into positive readings and is now challenging resistance at the 36000 point level. Futures are indicating a pause on the open this morning however given the poor lead from Wall Street:
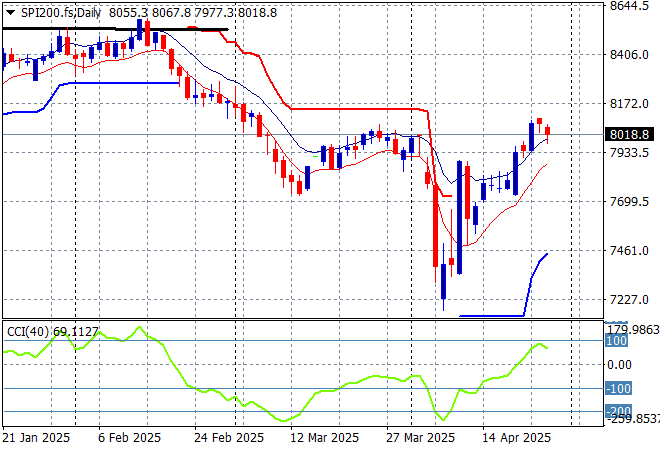
Australian stocks managed a solid session with the ASX200 up nearly 0.4% to almost breach 8000 points.
SPI futures are indicating another small rise on the open despite the flat night on Wall Street. The daily chart pattern suggests further downside could be inevitable as the Chinese counter-counter tariffs take effect but watch for a potential short covering rally past the 8000 point level first with resistance at the 8200 the real level to beat:
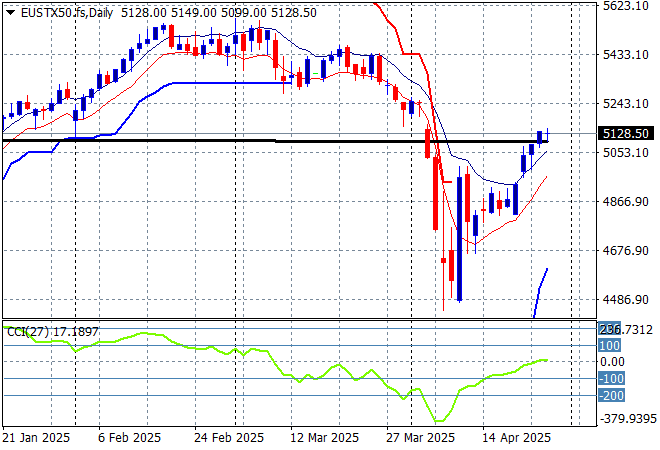
European markets also continued their rebound across the continent with the Eurostoxx 50 Index closing nearly 0.3% higher at 5170 points.
Support at the previous monthly support levels (black line) at 5100 points failed to hold so 2024 lows at the 4400 point level are still in sight, but there maybe life yet in this dead cat bounce:
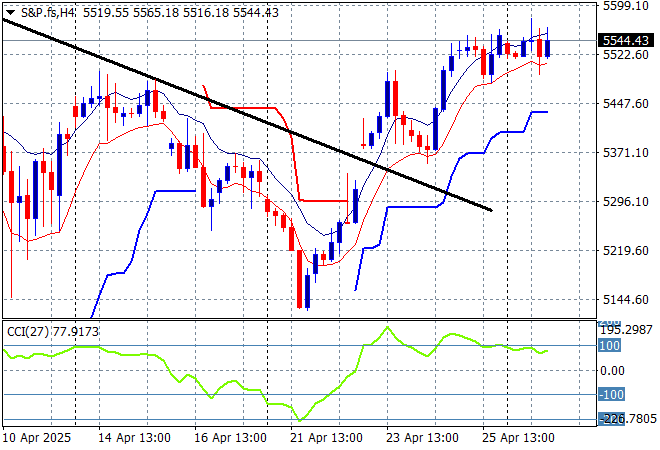
Wall Street continues to buy into the delusion that everything is awesome but some hesitation is starting to appear as the NASDAQ dropped slightly while the S&P500 managed a flat session to finish at the 5528 point level.
This was not looking good as the short term and medium term charts are pointing to a resumption of selling back below the 5000 point psychological barrier as the tariff impacts start to make themselves felt in earnings but this market is still beholden to literal fake news about tariff “deals”:
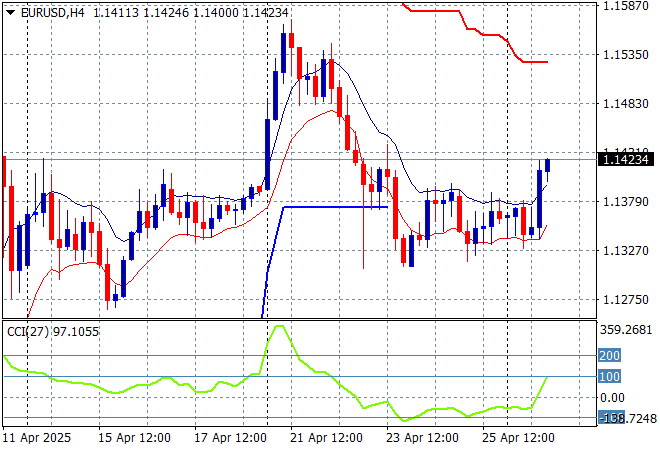
Currency markets are still trying to understand fact from fiction but the USD bid is starting to dwindle a little following relevations that there is no negotitation with China at all, which like the rest of the world is bypassing US trade. Weakness is returning with Euro breaking out overnight above the 1.14 level alongside Pound Sterling at a new three year high.
The union currency was pushed back down to the 1.13 handle last week as we watch for support to bounce back at the 1.12 level which corresponds to the 2023 and 2024 highs:
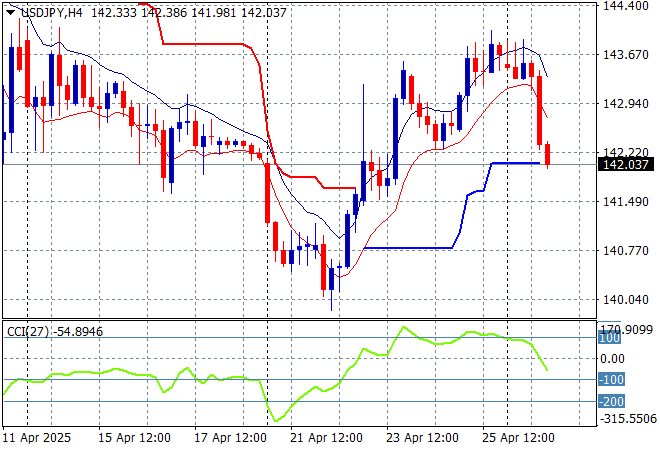
The USDJPY pair is showing this stark return to weakness as the pair could not push significantly above the 143 handle on Friday night and has dropped sharply overnight to the 142 level.
Watch for any sustained break below the 139 level next which completes a multi year bearish head and shoulders setup that could see the 110 to 120 level revisited:
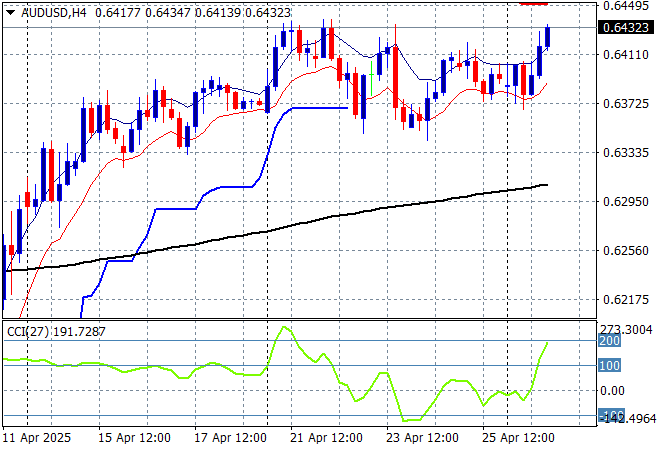
The Australian dollar was previously slowly extending its gains above the 64 cent level to extend above the pre-tariff announcement levels, but remains somewhat firm here despite not making a new high for over a week, finally matching that high early this morning.
Stepping back for a longer point of view (and looking at the trusty AUDNZD weekly cross) price action has crossed back above the 200 day MA (moving black line) after bouncing off a near new five year low. This is all about the USD, not the Australian economy so I’m wary here but you’ve got to follow price, keeping an eye on temporary support at the 63 cent level:
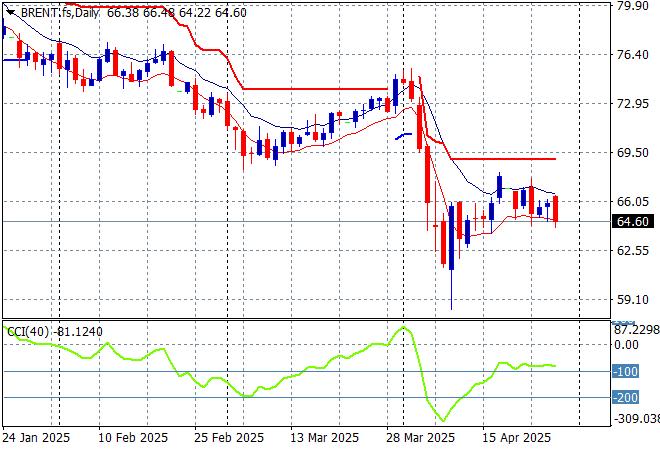
Oil markets are trying hard to hold onto its post tariff pause bounce but are facing other geopolitical ructions with Brent crude pushed below the $65USD per barrel level to match its start of week position following the weekend gap.
The daily chart pattern shows the post New Year rally that got a little out of hand and now reverting back to the sideways lower action for the latter half of 2024. The potential for a return to the 2024 lows is still building here as domestic demand in the US is likely to collapse despite the very short term change in sentiment:
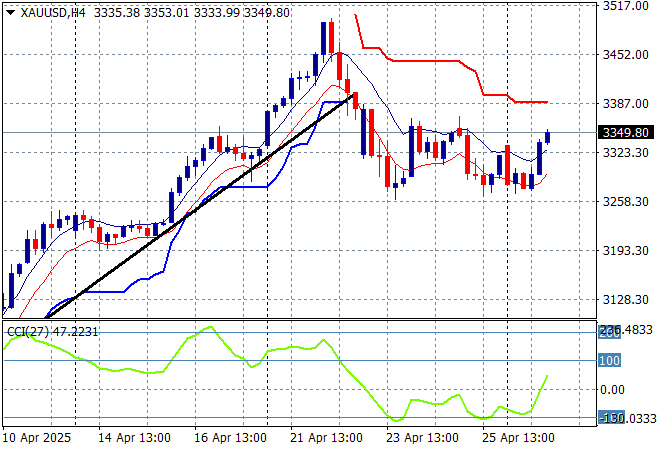
Gold pulled back somewhat on Friday night after sharply moving higher in recent weeks as it got way ahead of itself at least on the short term charts but is now trying to make another more sustained effort above the $3300USD per ounce level.
Short term support had firmed immensely in recent sessions showing real strength but momentum became considerably overbought so this was inevitable as price action has reverted back to the uptrend line from the April lows. There is further support at the $3200 level that could be tested next on the overshoot:
Glossary of Acronyms and Technical Analysis Terms:
ATR: Average True Range – measures the degree of price volatility averaged over a time period
ATR Support/Resistance: a ratcheting mechanism that follows price below/above a trend, that if breached shows above average volatility
CCI: Commodity Channel Index: a momentum reading that calculates current price away from the statistical mean or “typical” price to indicate overbought (far above the mean) or oversold (far below the mean)
Low/High Moving Average: rolling mean of prices in this case, the low and high for the day/hour which creates a band around the actual price movement
FOMC: Federal Open Market Committee, monthly meeting of Federal Reserve regarding monetary policy (setting interest rates)
DOE: US Department of Energy
Uncle Point: or stop loss point, a level at which you’ve clearly been wrong on your position, so cry uncle and get out/wrong on your position, so cry uncle and get out!