The Market Ear on the great flush.
No one’s in
Positioning is wrecked, volatility just snapped lower, and risk appetite has fallen off a cliff. But with buybacks set to return, vol-control exhaustion kicking in, and sentiment at extreme lows, the stage might be quietly set for a rebound no one’s ready for.
Zooming out
SPX weekly chart bounced nicely on the long term trend line…
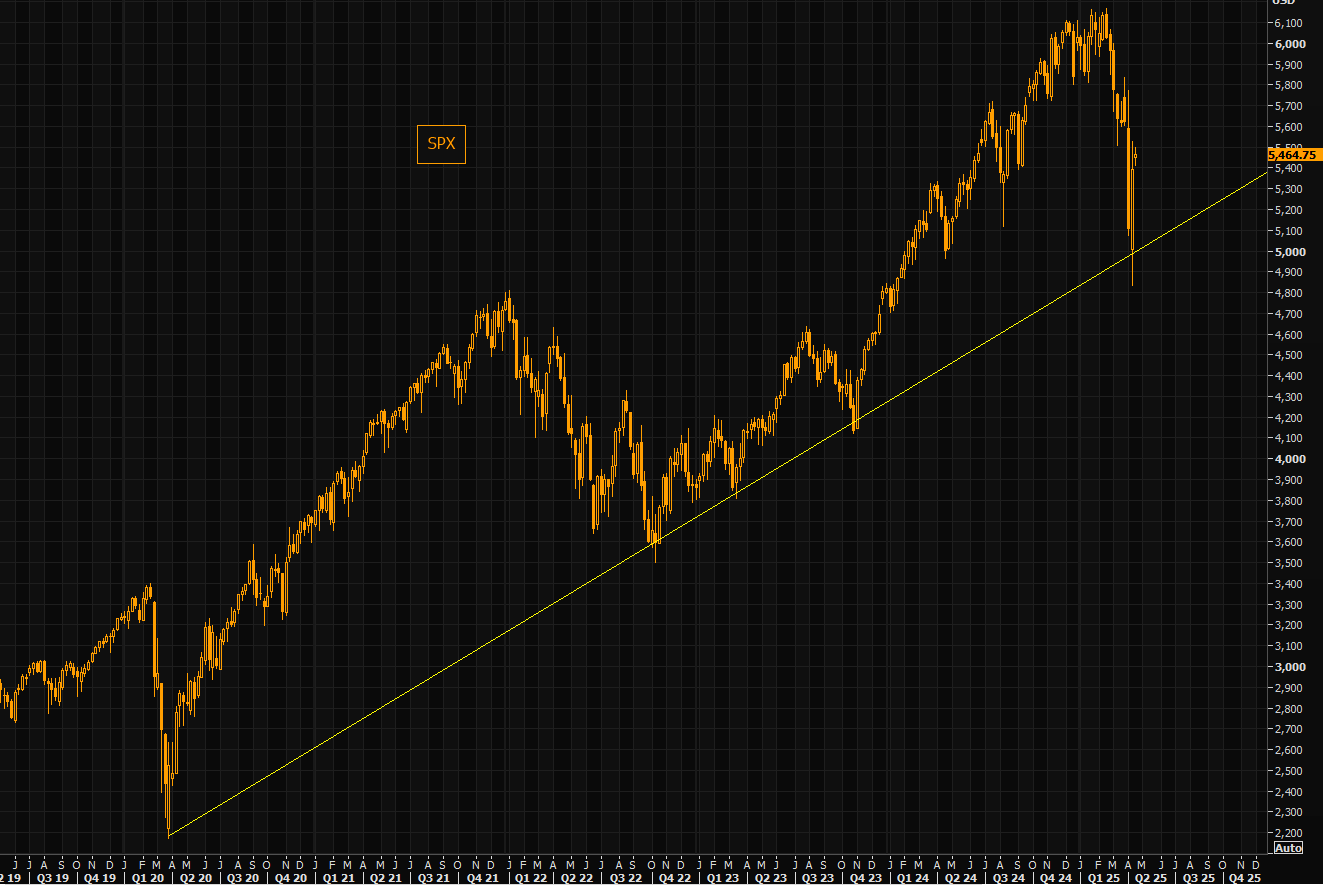
Refinitiv
VIX – “green shoots”?
VIX down big on a Monday, despite the SPX trading somewhat “muted”, shows you just how far VIX had gone ahead of itself. We have seen extreme volatility, but such levels are not sustainable. A further VIX fade could provide support for this market.
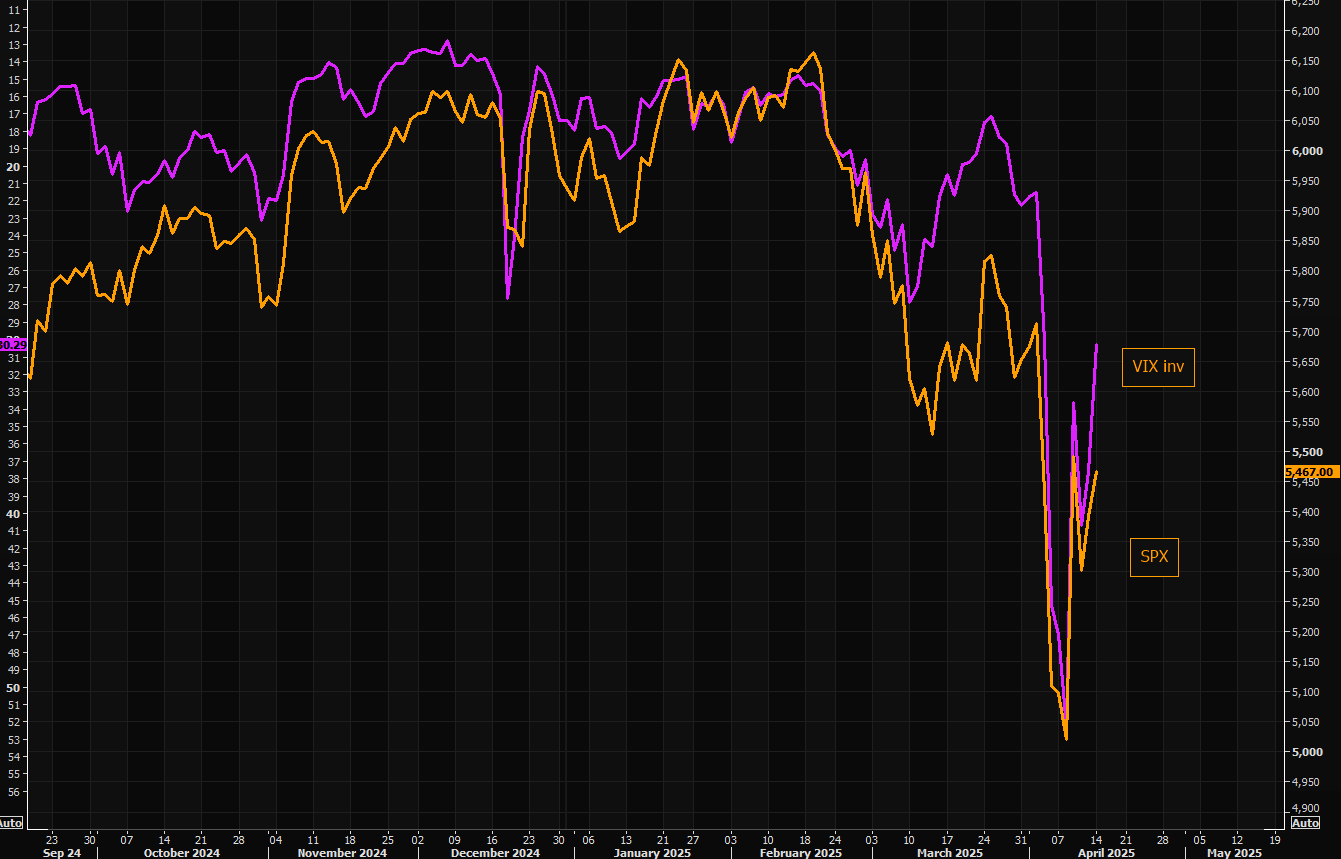
Refinitiv
Depressed
Consolidated equity positioning has crashed. Currently 2% tile (since 2010).
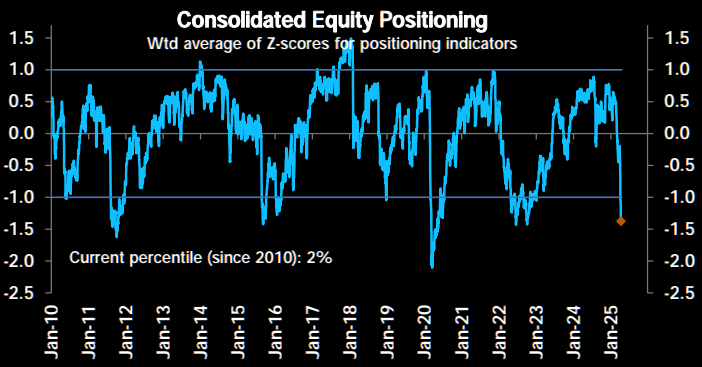
DB
Lowest long…
…in a long time. US institutions in US index futures.
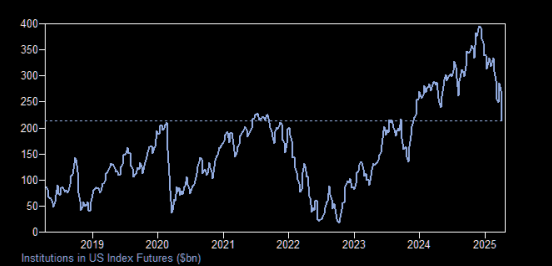
GS
0th percentile
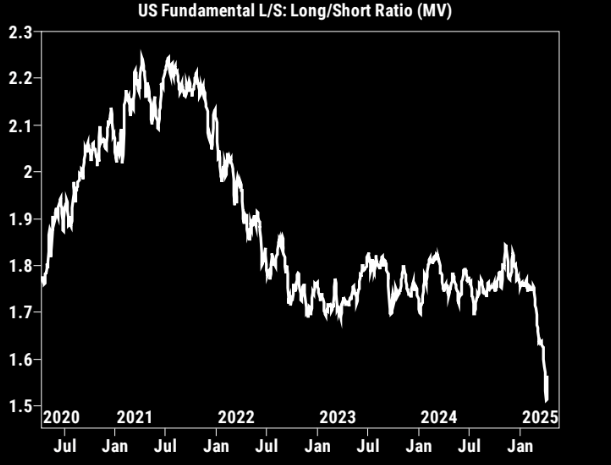
US Fundamental Long/Short Net Leverage rose by +3.2 percentage points to 45.2%, though it remains near five-year lows (in the 0th percentile). Meanwhile, the US Fundamental Long/Short Market Value Ratio increased +2.8% to 1.574, placing it in the 1st percentile over the past five years.
GS Prime
Systematics
Positioning 4% tile…
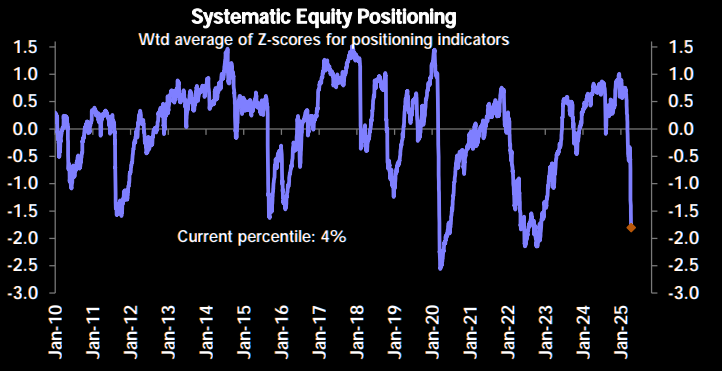
DB
Buy high, sell low
Vol controlled strategies have puked equities during the crash. Current percentile: 1%…not far from Covid lows.
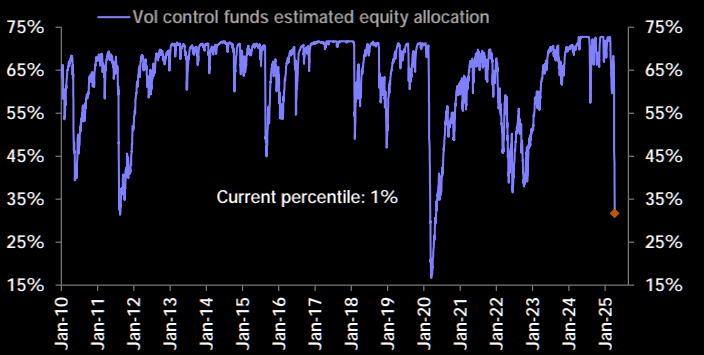
DB
Risk appetite
Free falling…
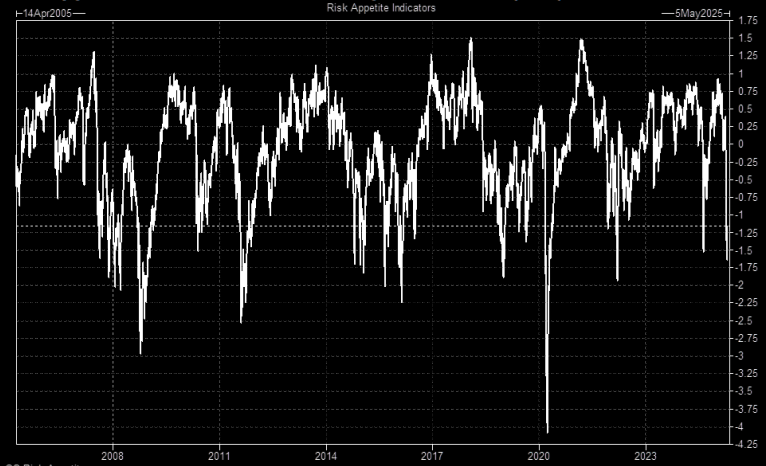
GS
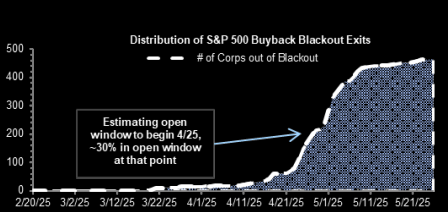
Warming up the VWAP bid
GS estimates the buyback blackout to end around April 25.
GS
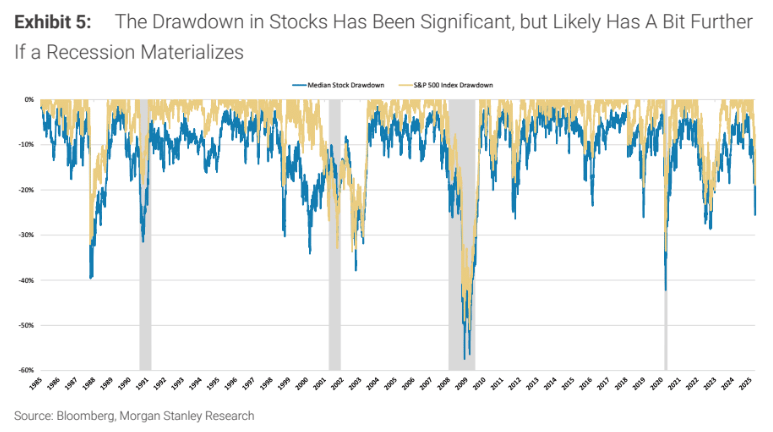
Michael Wilson at Morgan Stanley is making sense.
Looking at the drawdown of stocks more broadly also paints a picture that suggests the market correction is well advanced, but probably not complete IF we end up in a recession or the fear of one gets more fully priced.
This remains the key question for stock investors, in our view, and is why markets are likely to remain in a range (5000-5500 inSPX terms) and volatile until we have a more definitive answer to this question or the Fed decides to circumvent the growth risks like last fall which did buy us time.
With the Fed more constrained on the inflation front than last fall, it appears likely to err on the side of remaining on hold despite elevated recession risk (our economists expect no cuts this year).
As Exhibit 6 and Exhibit 7 show, it’s a similar performance story at the sector/industry level, with many cohorts experiencing a drawdown as great as 2022.
Bottom line, we’ve experienced a lot of price damage, but it’s too early to conclude that the durable lows are in with policy uncertainty persisting, earnings revisions in a downtrend, the Fed on hold and back end rates elevated.
I expect that the sudden freeze in US/China trade that is about to land will be a lot worse for a material number of firms than most realise.
Vizion has more.
A Sudden April Crash in Bookings
As tariff-related uncertainty intensified, booking volumes collapsed in real time. Comparing the week of March 24–31, 2025 to the following week, April 1–8, 2025, we saw sharp declines:
- Global TEUs Booked: ↓ 49%
- Overall U.S. Imports: ↓ 64%
- Overall U.S. Exports: ↓ 30%
- U.S. Imports from China: ↓ 64%
- U.S. Exports to China: ↓ 36%
This dramatic drop aligned with two key developments: the April 4th U.S. tariff announcement, followed by China’s retaliatory measures announced on April 5. The result? A widespread booking freeze, as shippers paused mid-shipment cycle to reassess costs, timelines, and broader trade strategy.

Week-over-Week Drop in U.S. Imports by Product Type
Zooming in on product-level trends between March 31-April 6, 2025, and the prior week (March 24-30) reveals sharp booking declines across several categories:
- Apparel & Accessories: ↓ 59%
- Wool, Fabrics, and Textiles: ↓ 57%
- Art, Antiques, Umbrellas, Feathers: ↓ 50%+
These are largely discretionary or seasonal categories, often the first to react to rising costs, demand shifts, or trade policy changes. Many of these goods also fall under one of many tariff adjustments, making them more sensitive to uncertainty and pricing volatility in the short term.

Week-over-Week Drop in U.S. Imports from China by Product Type
Imports from China showed similar pain, particularly in foundational manufacturing inputs:
- Plastics: ↓ 45.4%
- Copper: ↓ 31.1%
- Wood Products: ↓ 24.0%
These categories are deeply tied to industrial and manufacturing supply chains and now face significant tariff pressure. On April 10, the White House clarified that tariffs on Chinese goods now total 145%, combining the previously announced 125% rate with an additional 20% import tax tied to other enforcements. This sharp increase in effective duty rates has already created significant hesitation in forward bookings from China, especially in high-volume, high-cost raw material categories.

The message is clear: Shippers moved early to get ahead of tariffs, and then hit the brakes as conditions changed. This behavior, visible in booking data weeks before it shows up at the port, shows just how critical forward-looking logistics intelligence has become.
With tariffs from other trade partners currently on a 90-day pause, shippers are navigating a highly uncertain and fast-changing trade environment. The rest of 2025 is likely to bring continued volatility marked by demand swings, accelerated ordering patterns, and a re-evaluation of sourcing strategies the global response to these trade actions continues to unfold.
While some of this may be seasonal, not all.